Guides
Day-to-day flows in the Spanline app. For the first capture, see Getting started.
Create an Inbox
- Open Capture from the product rail (or Home → continue Capture).
- Choose New Inbox in the context bar when you want a fresh catch URL.
- Optionally set the default mock response (status, headers, body, delay) and link a Project.
- Copy the catch URL after creation.
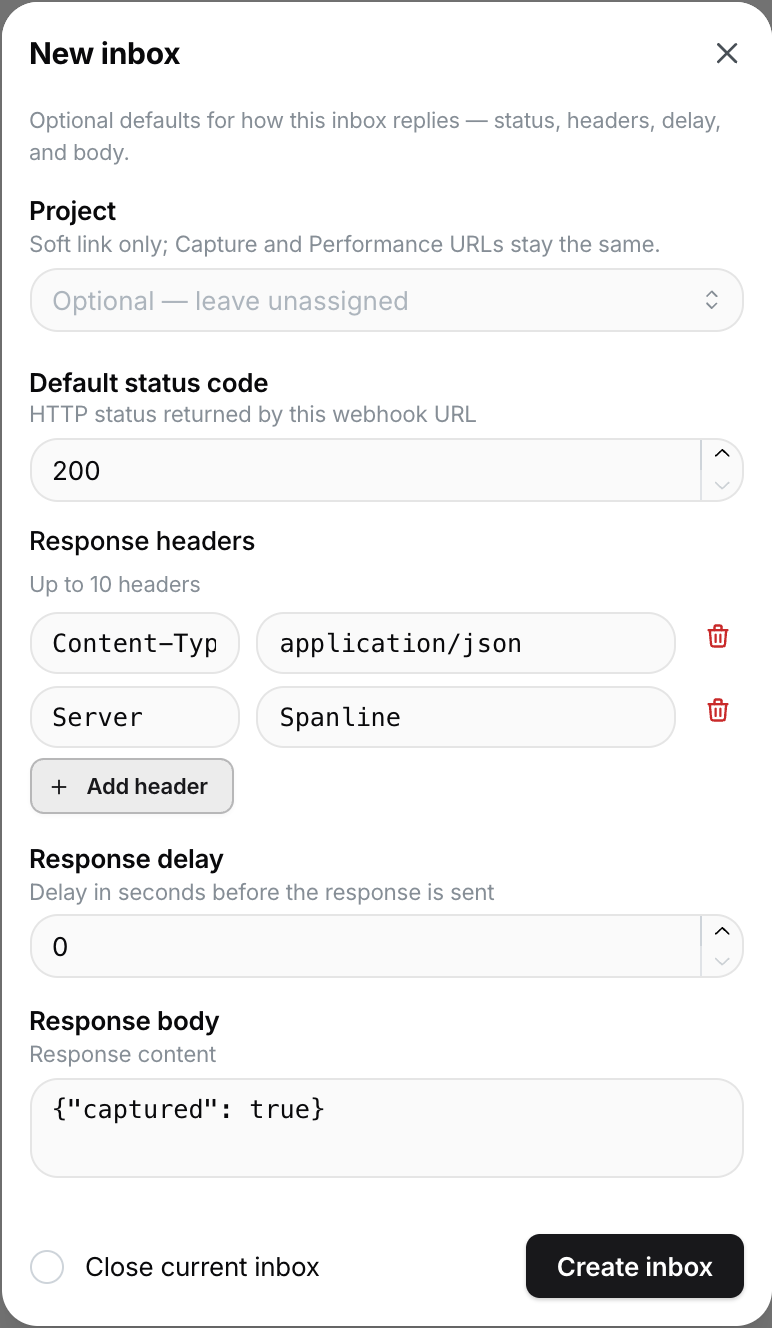
Optionally assign a Project in the product so related work stays grouped.
Receive traffic
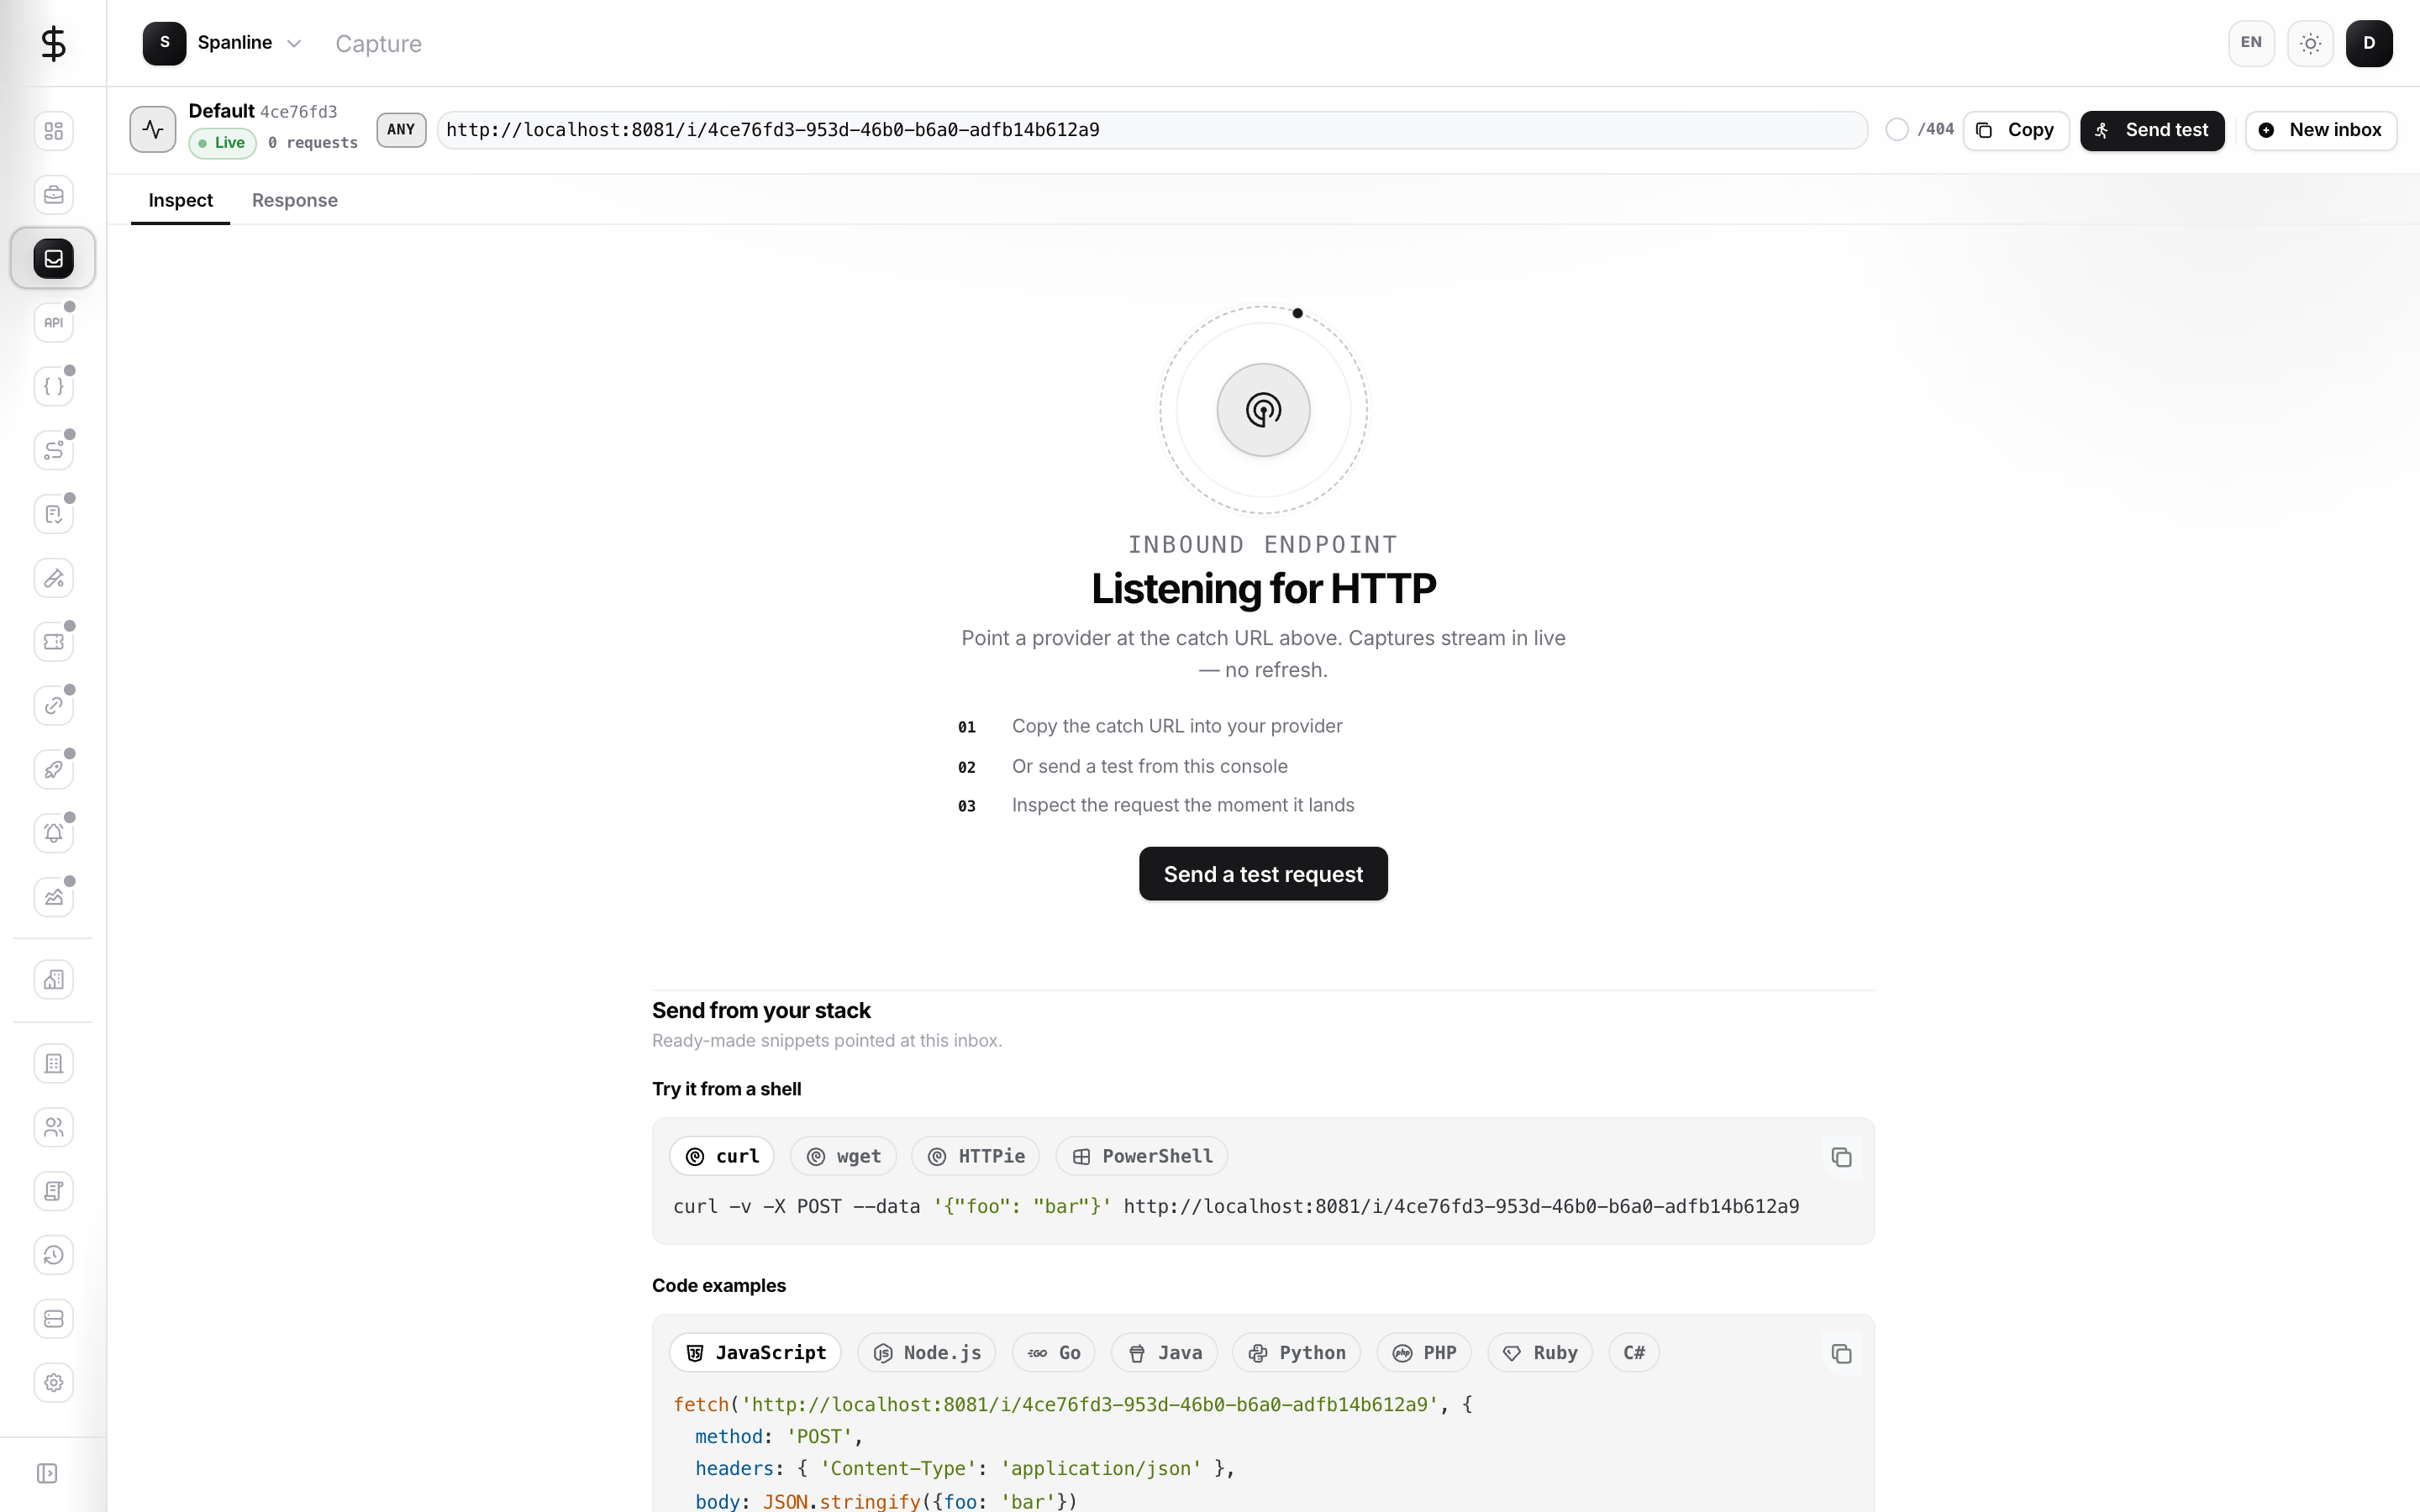
- Paste the catch URL into your provider’s webhook settings, or send a test request with any HTTP client.
- Confirm the request appears in the sidebar list.
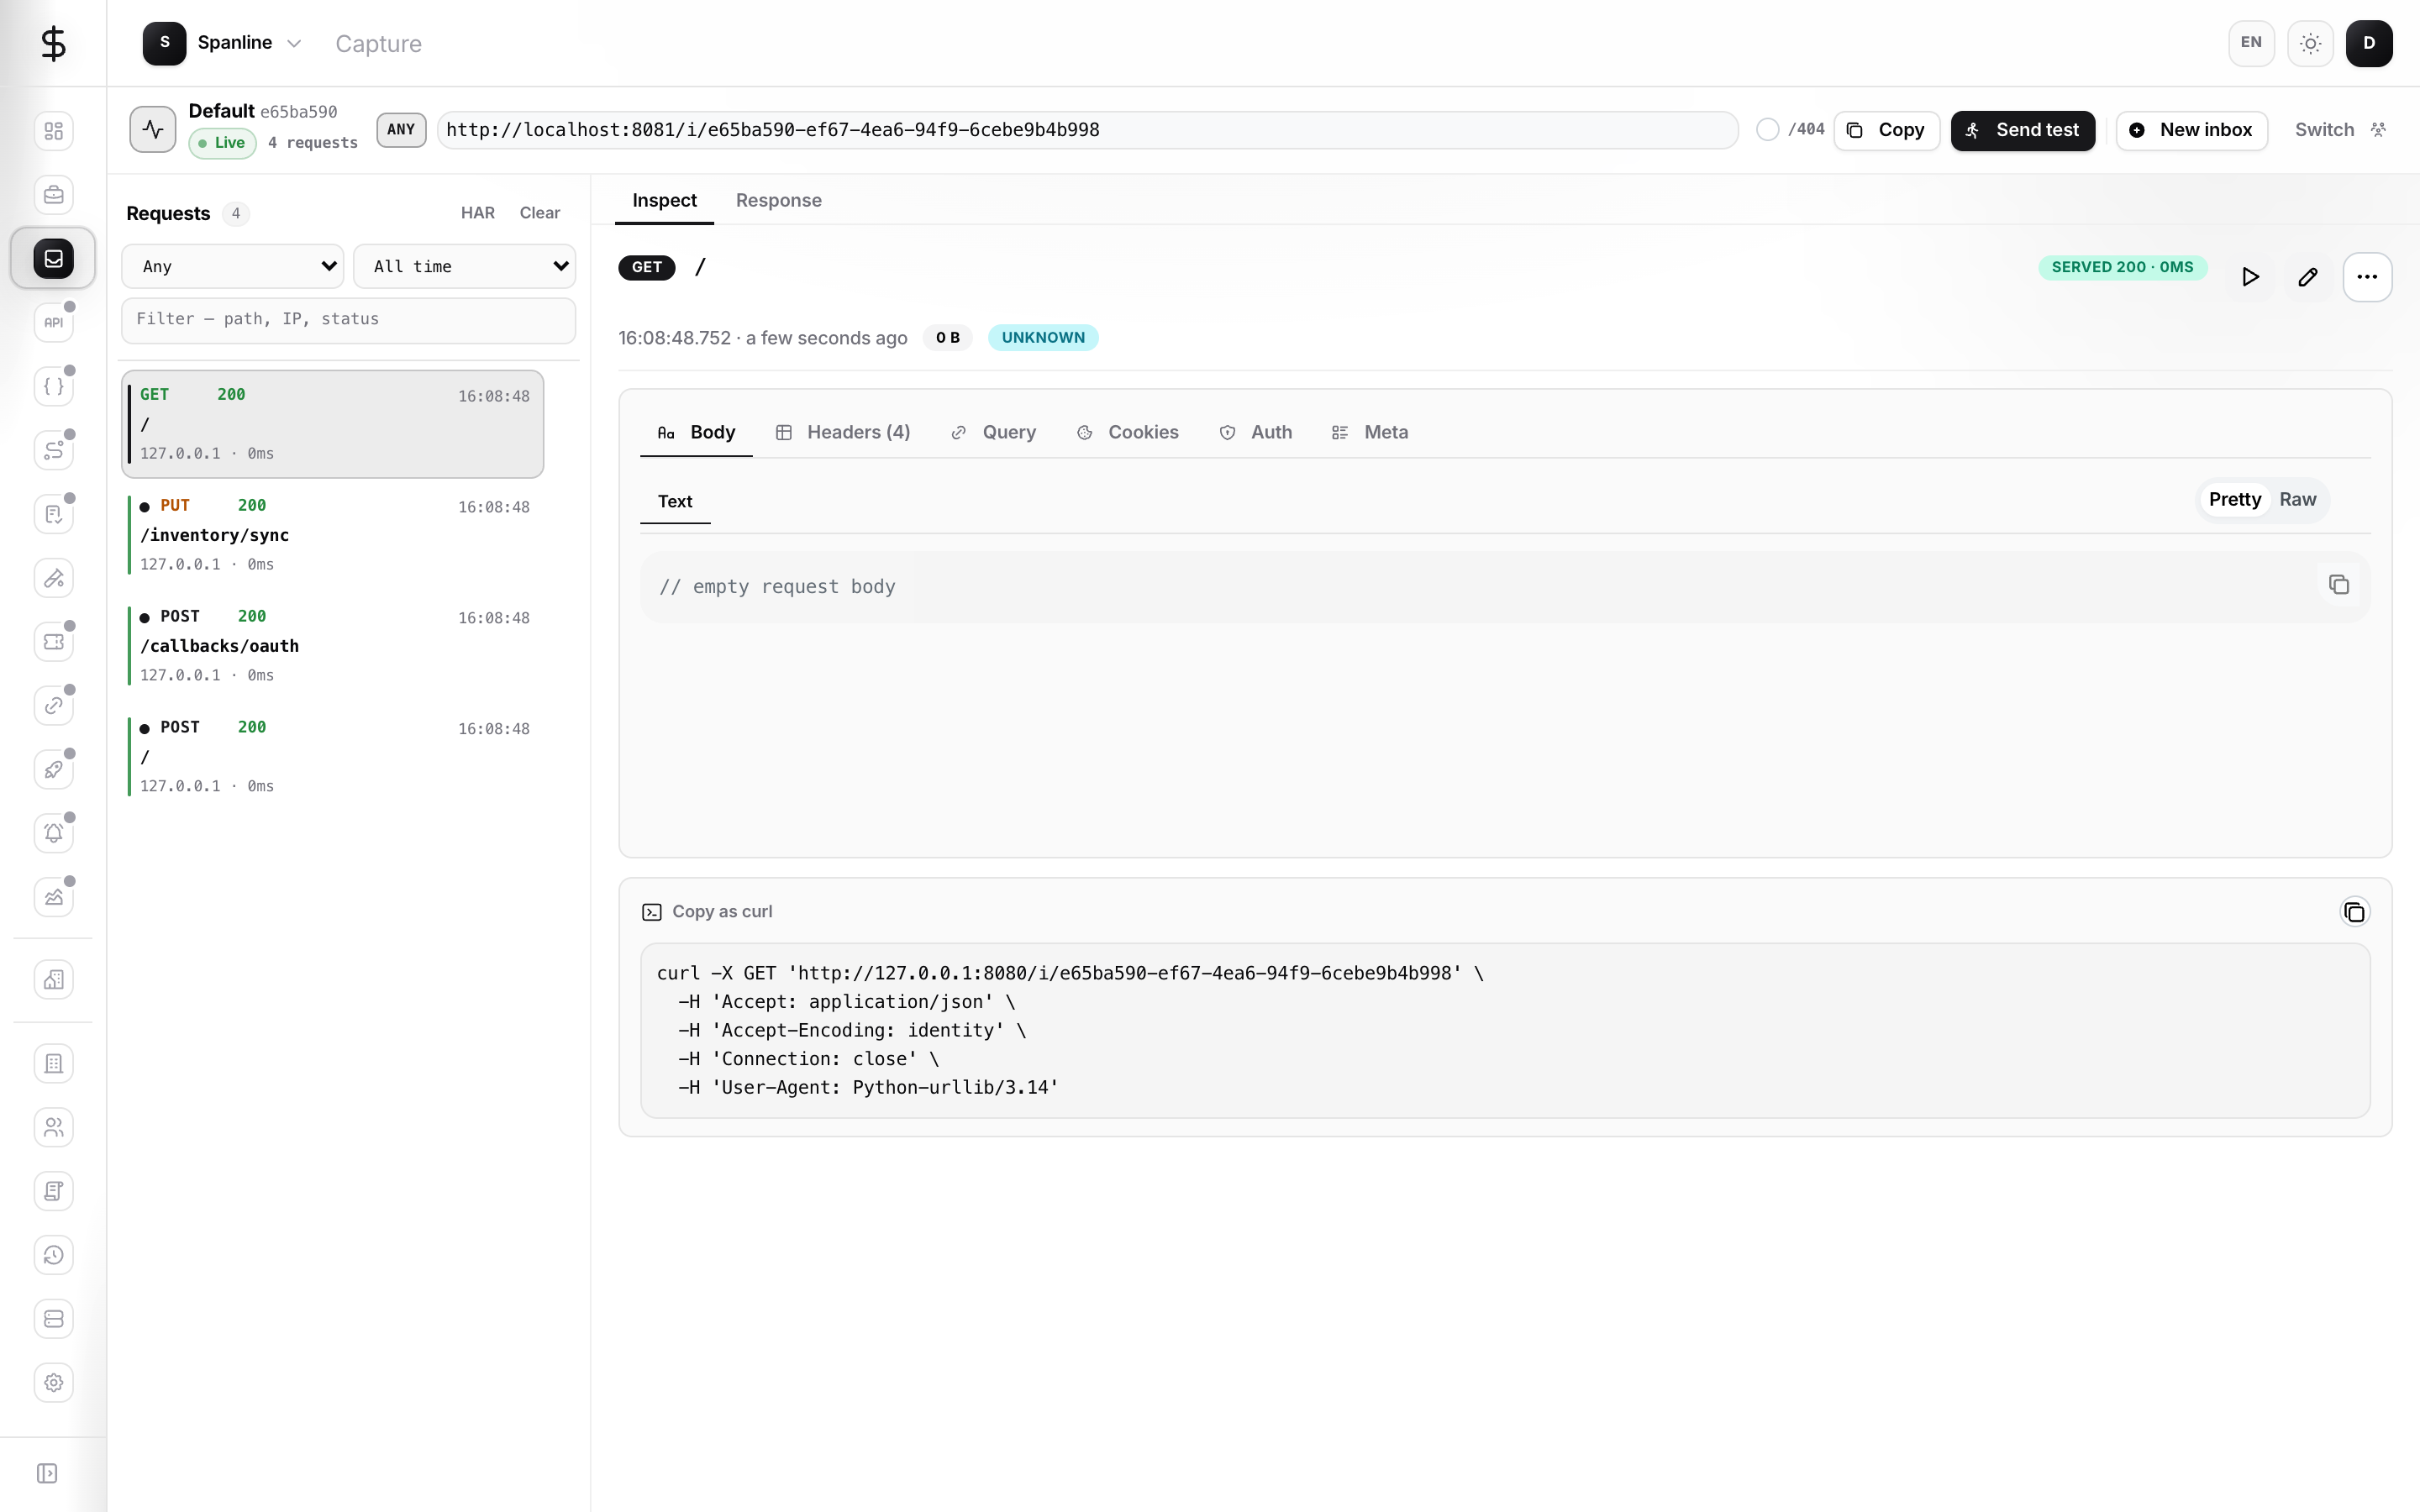
- Open a request to inspect headers, body, and timing.
curl -X POST "https://api.spanline.dev/i/<your-inbox-id>" \
  -H "Content-Type: application/json" \
  -d '{"event":"demo"}'
Response headers from Spanline include a request id you can use when correlating with the sender’s logs.
On an empty Inbox, use Send test or copy a snippet from the listen hero:
Inspect requests
- Open Capture and select an Inbox (switch from the context bar if you have several).
- Choose a request in the sidebar.
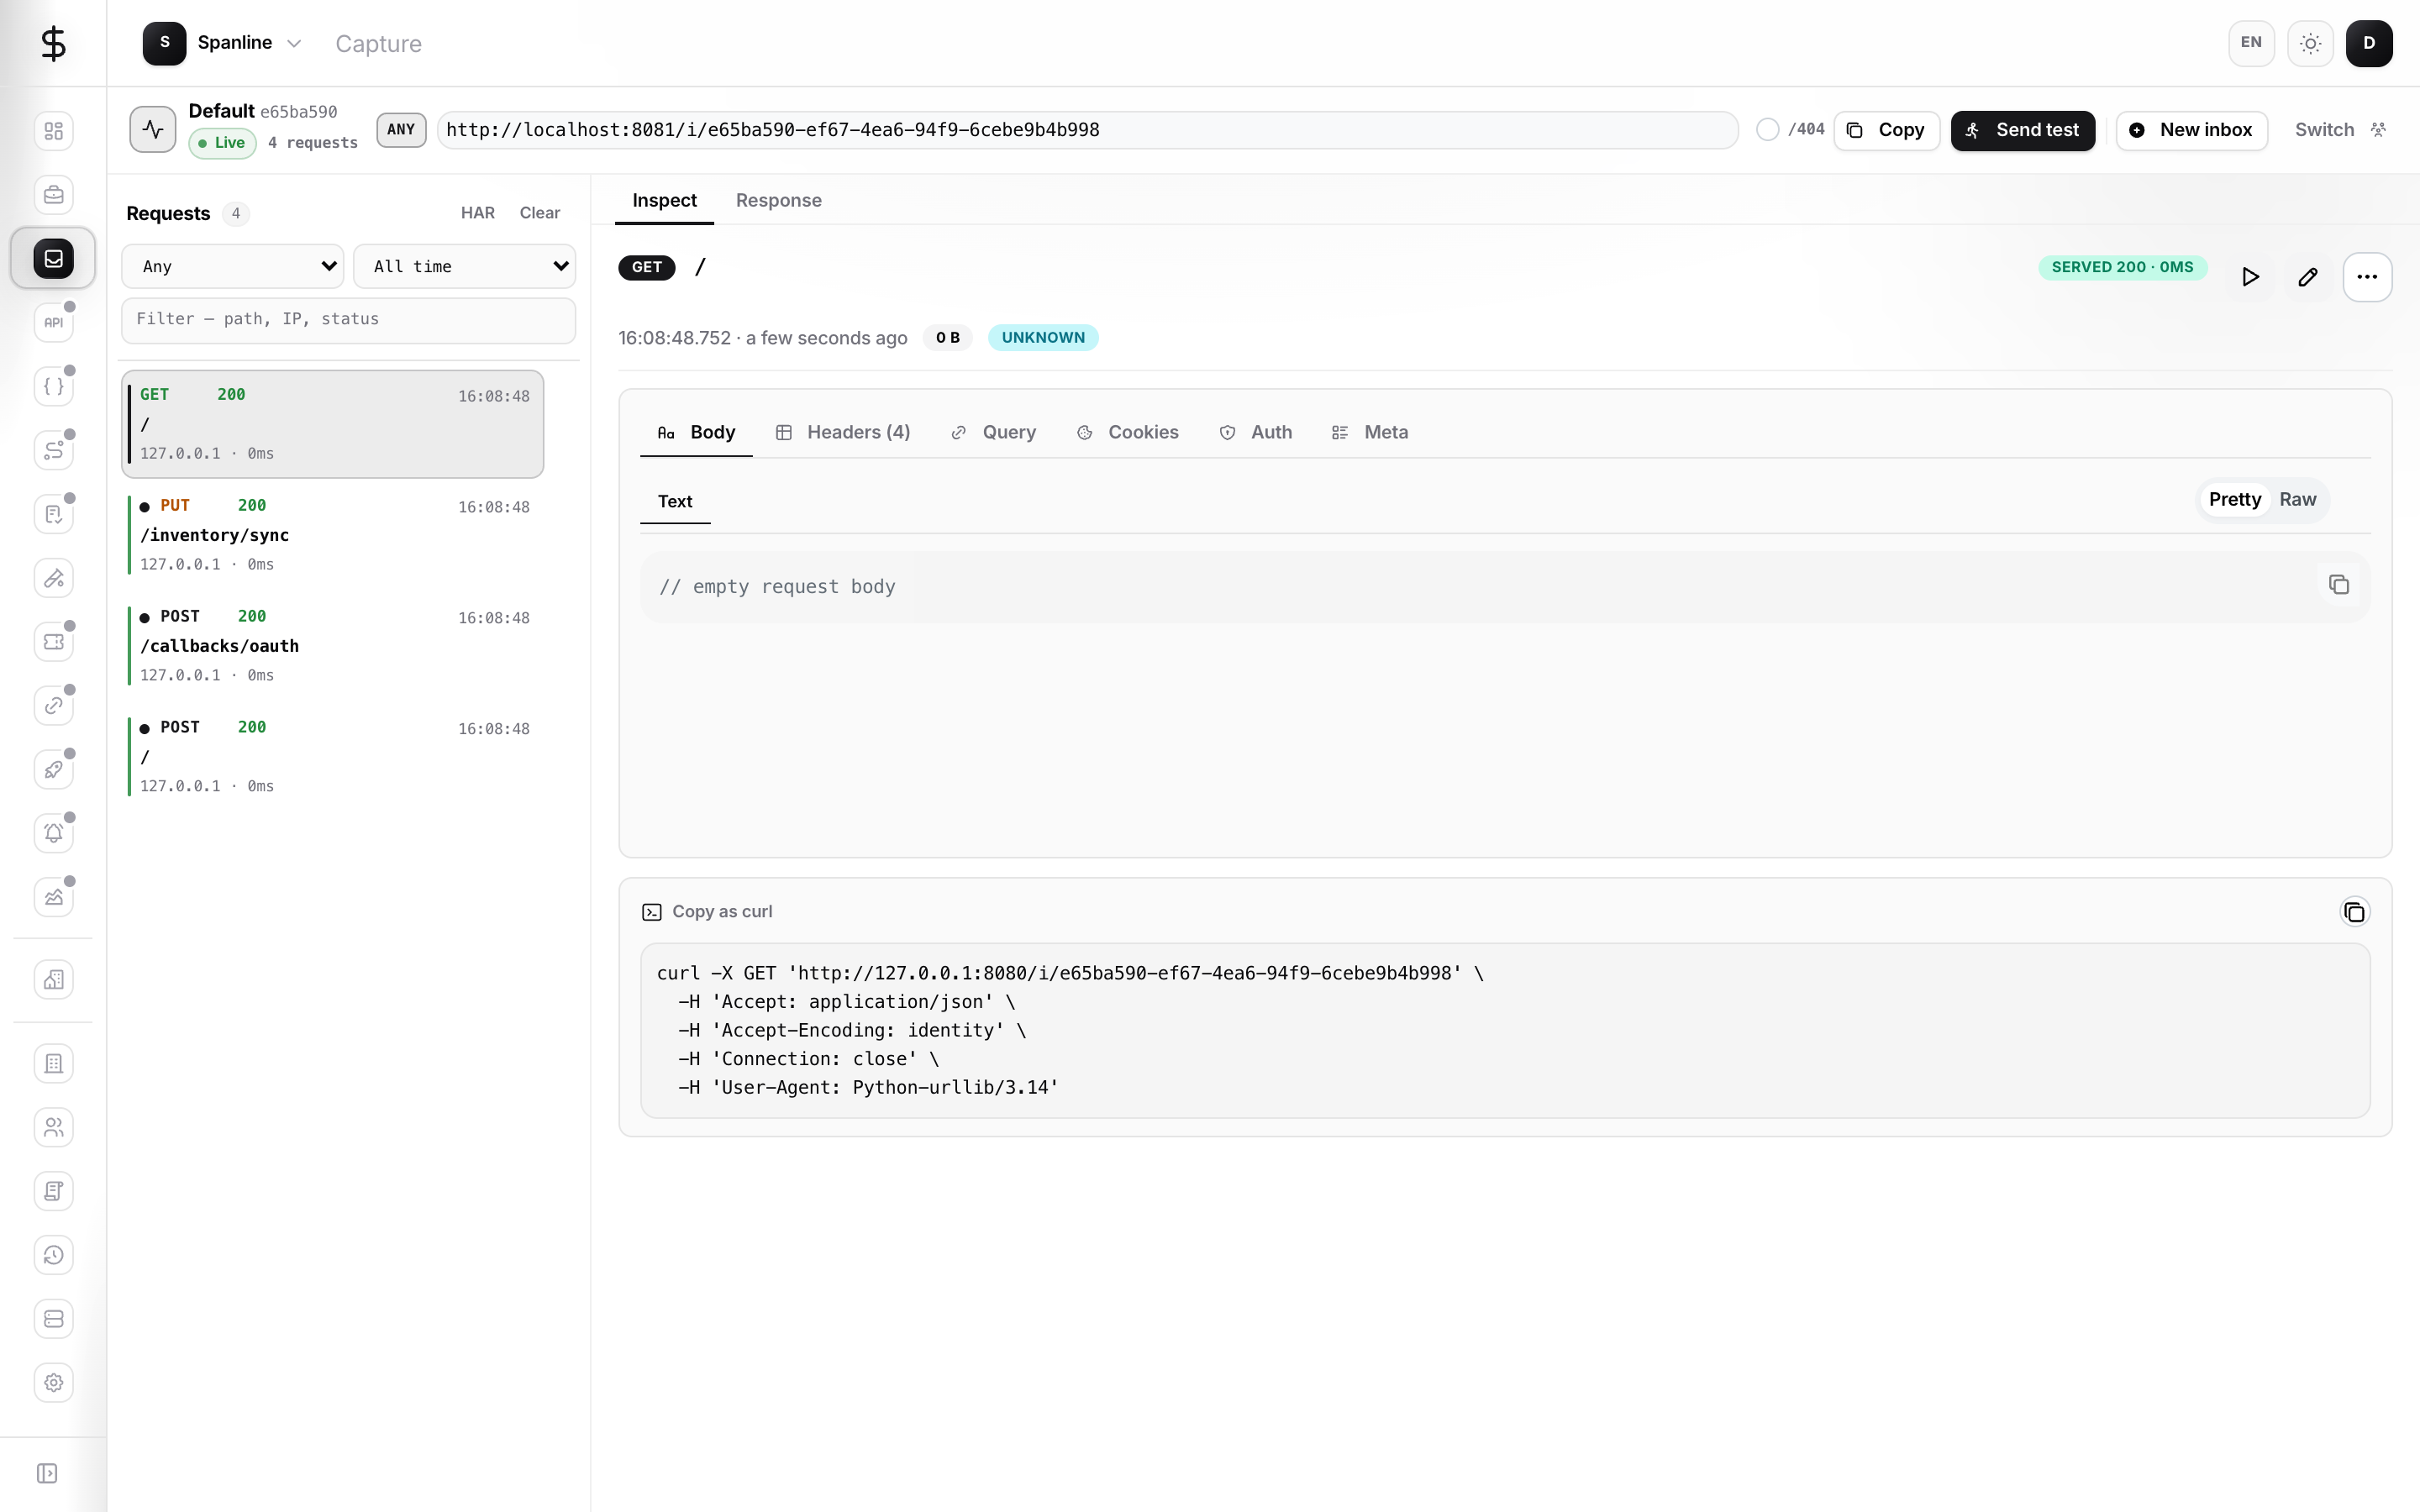
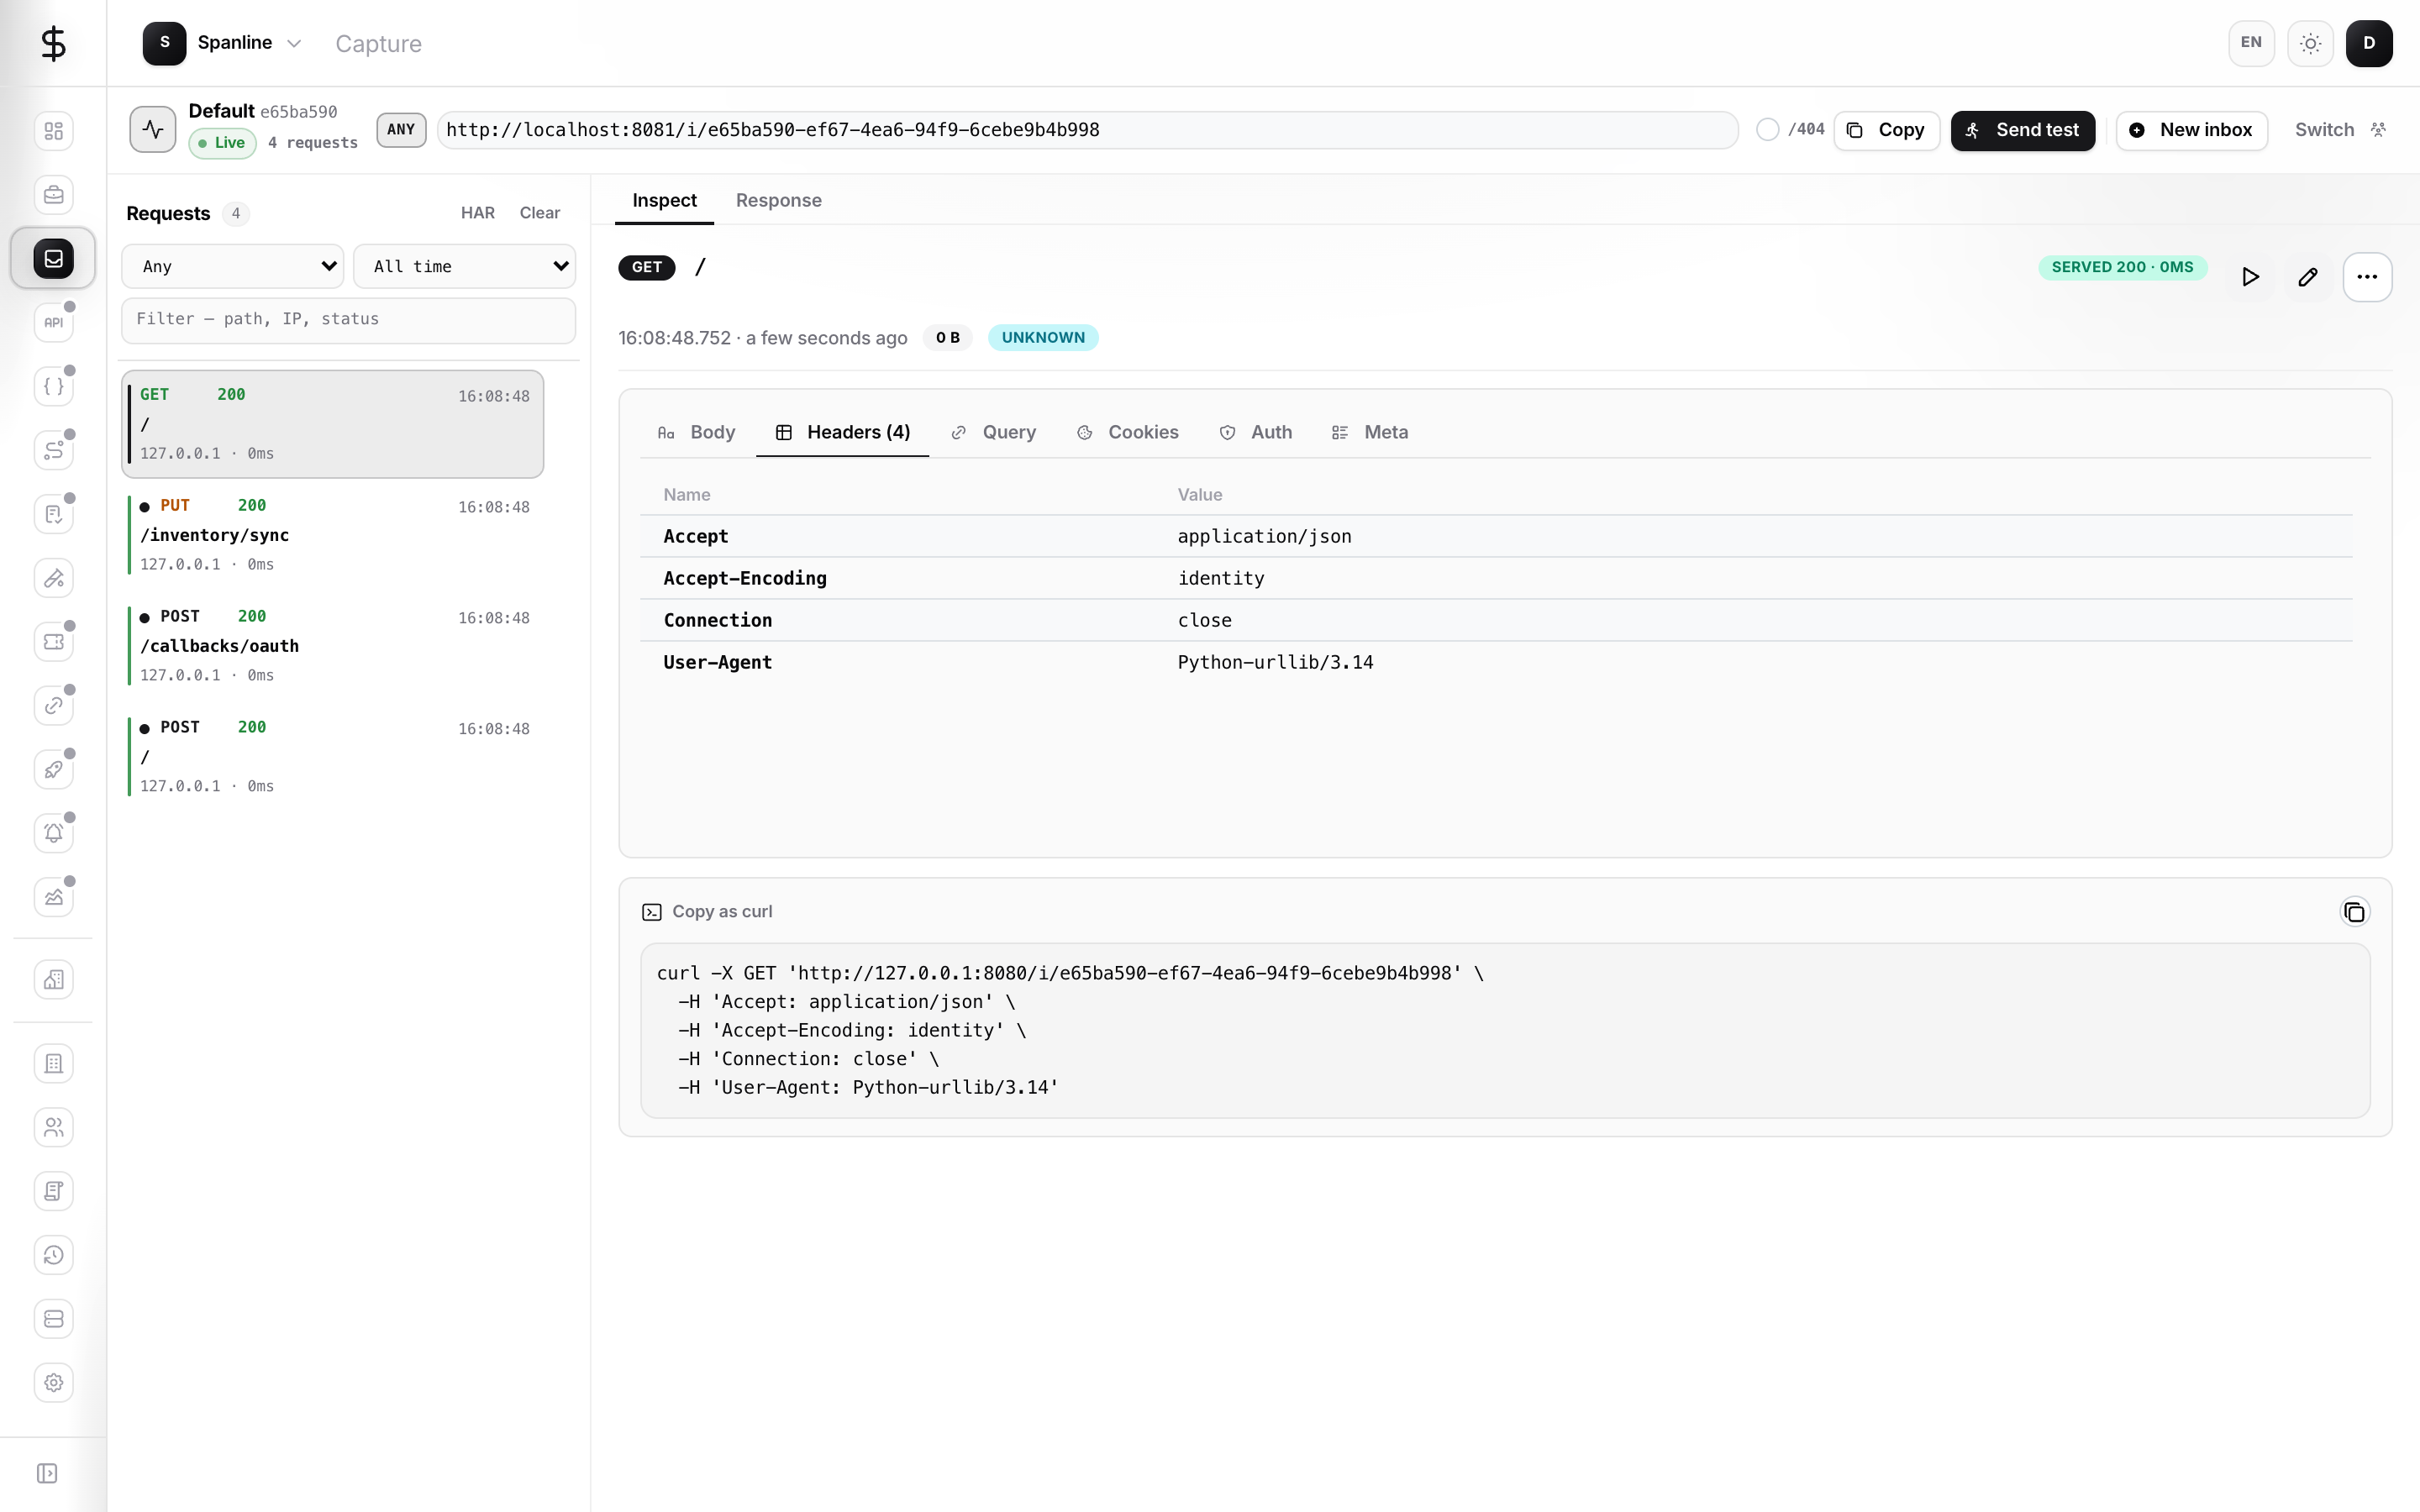
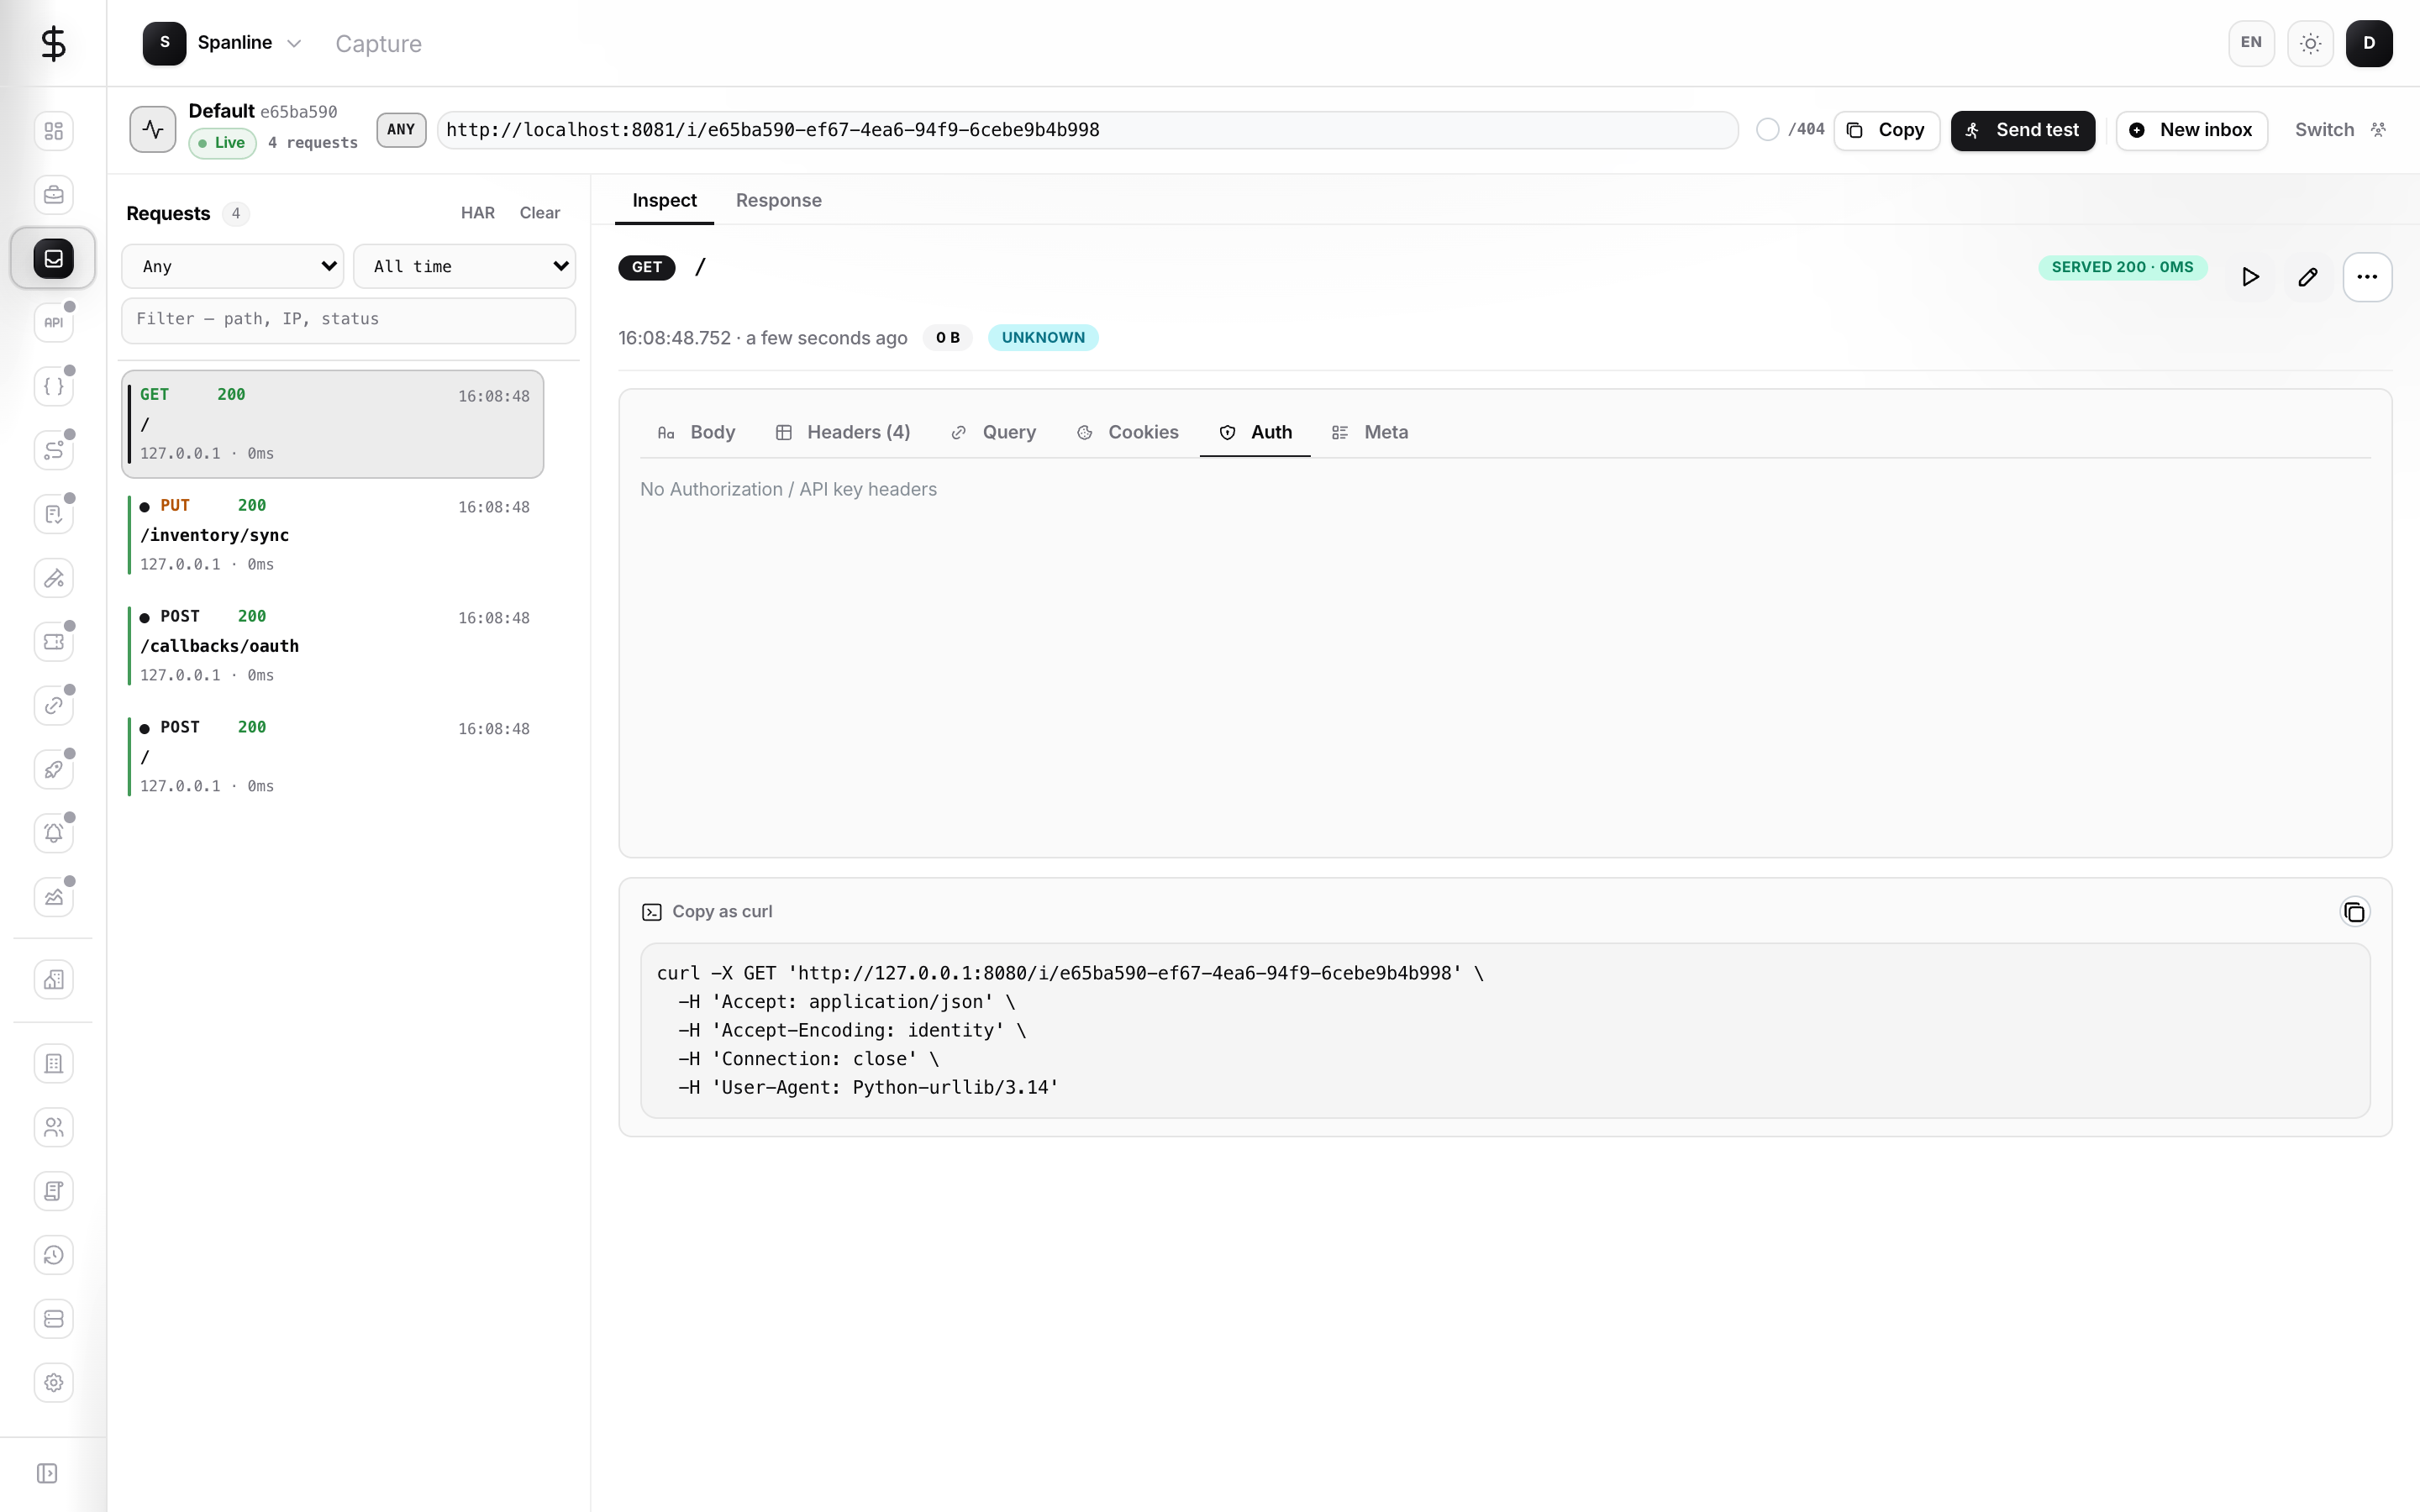
- Use the inspector tabs: Body (text / binary), Headers, Query, Cookies, Auth, Meta.
- Use Help for your catch URL and any limits shown for your workspace.
Inspector tabs
| Tab | What you see |
|---|---|
| Body | JSON, text, or hex for binary payloads |
| Headers | Incoming request headers (and response headers in the rail) |
| Query | Parsed query parameters |
| Cookies | Cookie header breakdown |
| Auth | Detected API keys, Bearer tokens, basic auth |
| Meta | Timing, client address, request id |
Configure a mock response
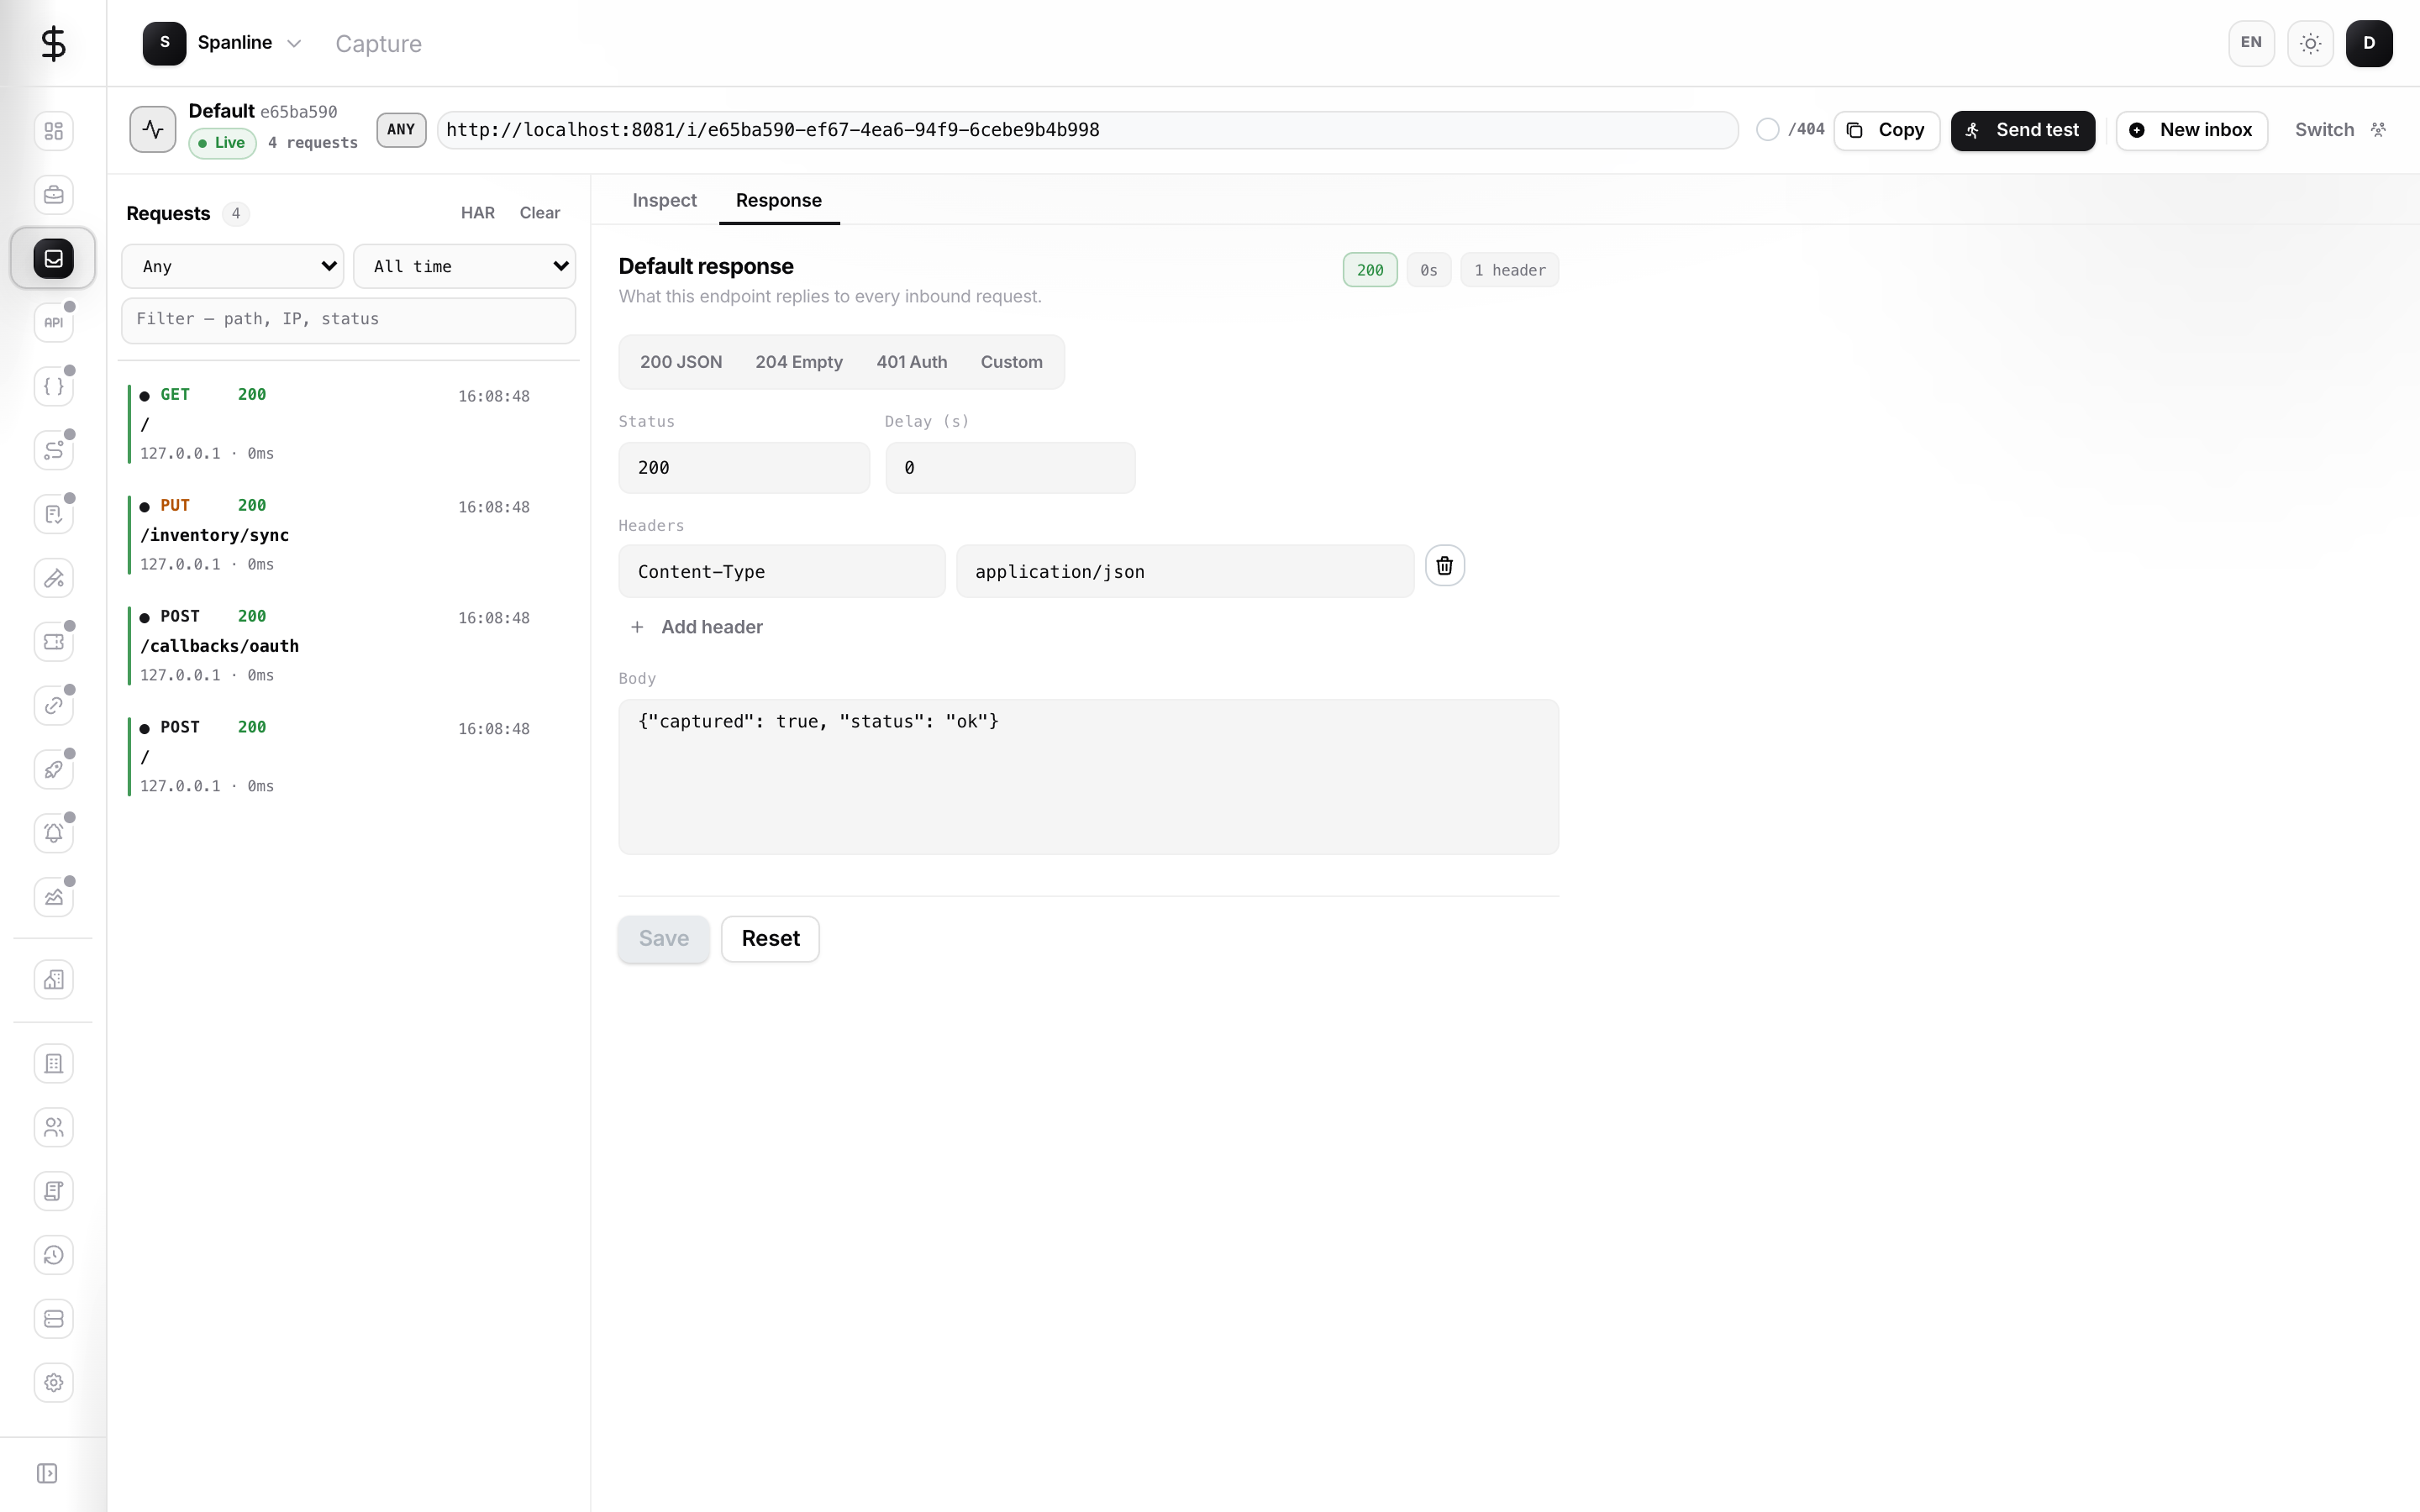
Decide what callers receive while you debug:
- HTTP status
- Response headers and body
- Optional delay (reflected in timing)
Open the Response tab in the console. Pick a preset (JSON 200, empty 204, 401 auth challenge) or edit fields directly. Changes save to the Inbox on the server.
Capture also allows browser-based tests from other origins when you need them.
Replay a request
Open a request → Replay (same catch URL) or Edit & Replay (tweak method, path, target, headers, body first).
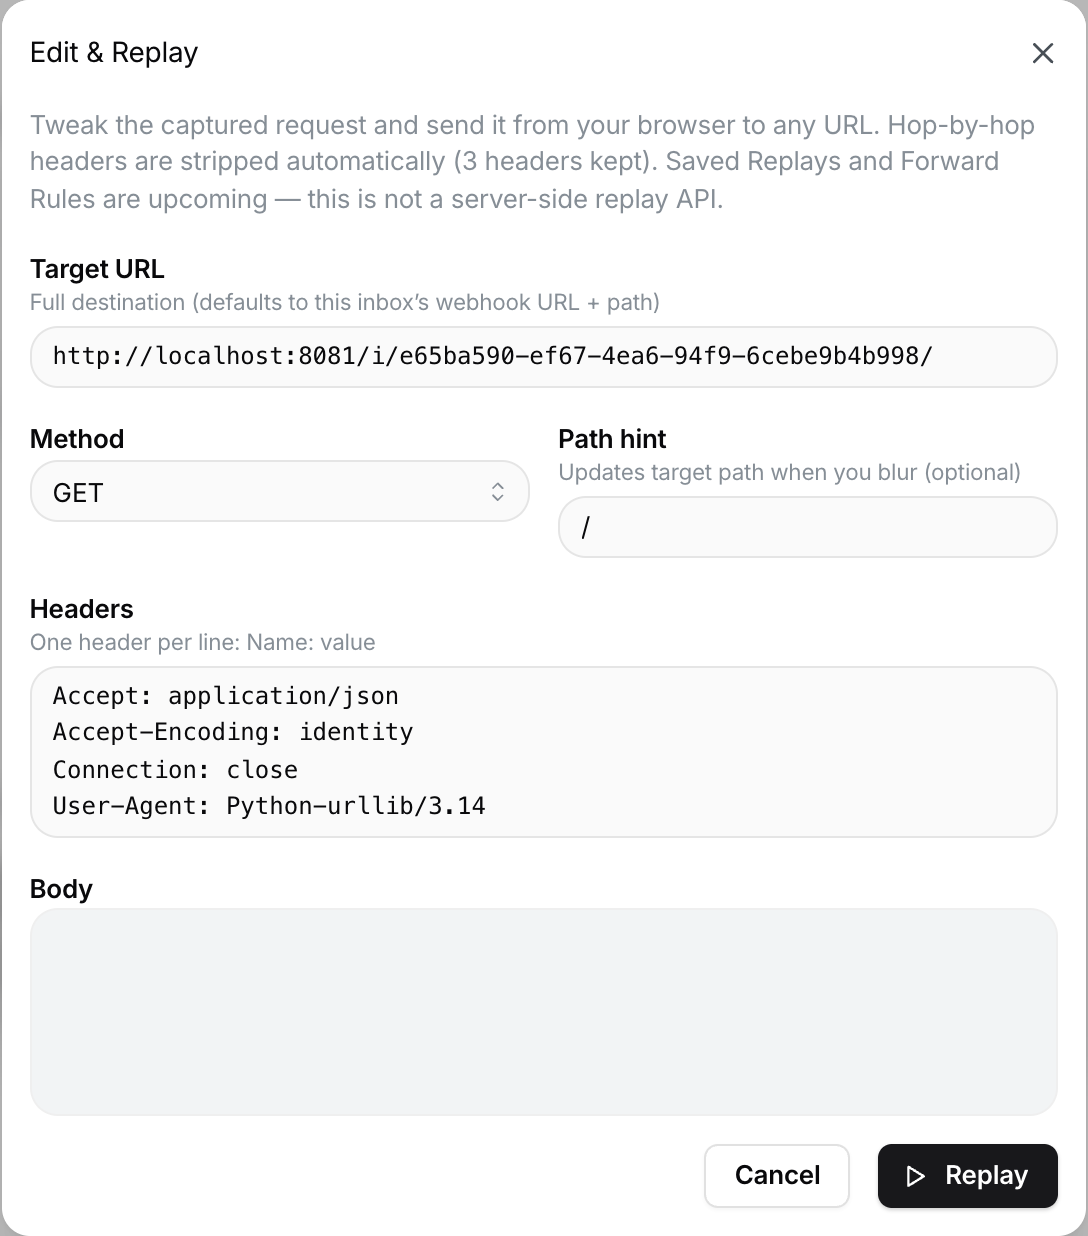
- Prefer relative replay when testing against the same path context.
- Use an absolute URL only for trusted targets — replayed requests may still carry original auth headers.
Replay runs from your browser; it is not a server-side replay API.
Compare two requests
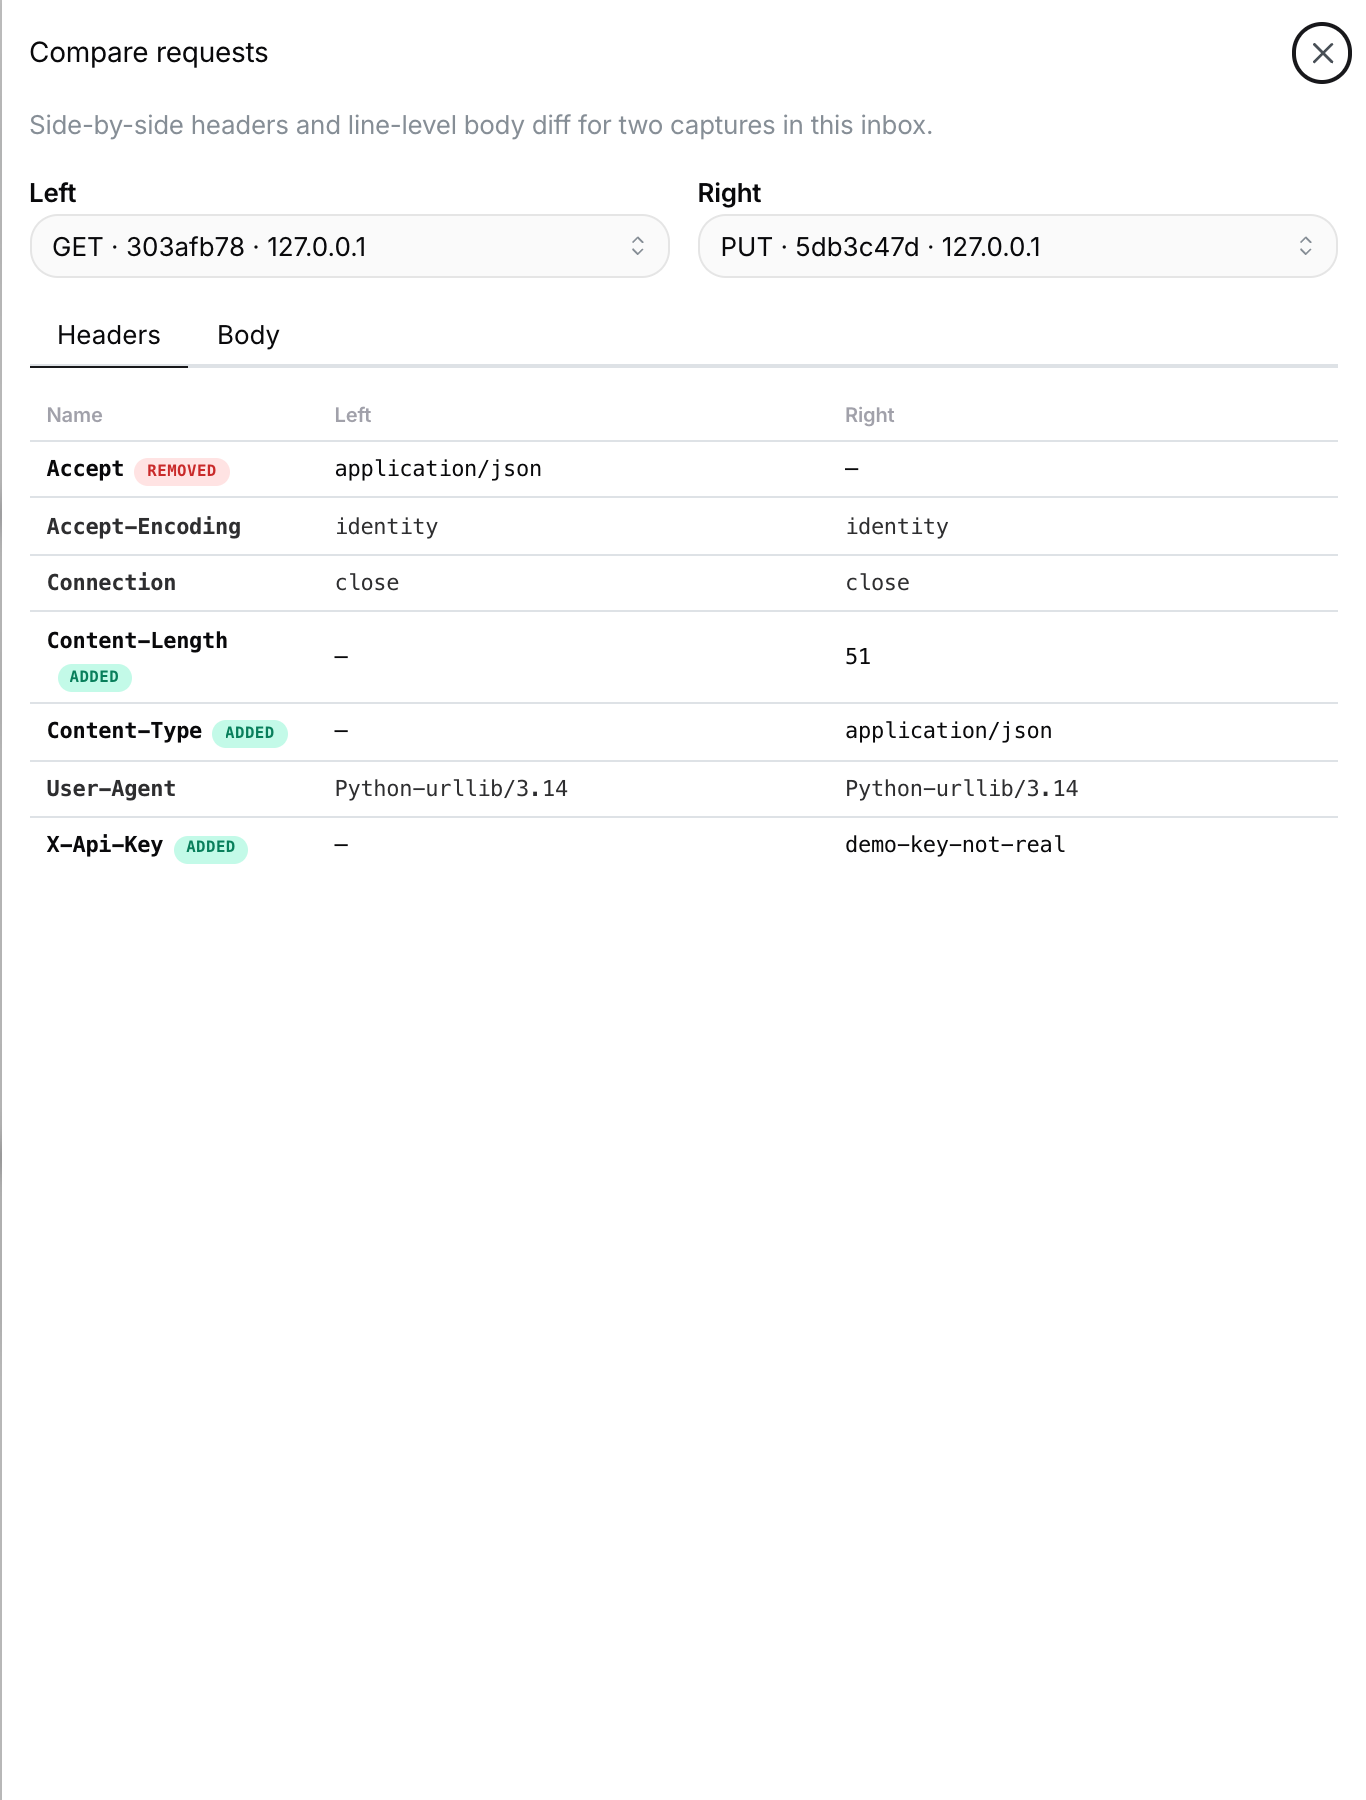
From request detail, open Compare (or add ?compare=1 to the URL). Pick a second request from the same Inbox and review header and body diffs.
Export HAR
From request details, use the export menu to download a HAR file. You can export the current request or the full session. HAR includes timing through the response Spanline served (including any configured delay). Handy for sharing with partners or importing into other tools.
Clean up
From the Inbox you can:
- Delete a single request (sidebar row menu)
- Clear all requests in the Inbox
- Delete the Inbox when you are done (Inbox switch → destroy)
Delete Inboxes that received production-like secrets when the investigation is finished.