Getting started
This page walks a normal workspace member through one successful capture end to end: create an Inbox, send a test request to the catch URL, and inspect it in the app. You do not need to be a platform admin.
If you already know Spanline Capture, jump to Guides.
What you will need
| Need | Notes |
|---|---|
| Spanline account | Sign in at app.spanline.dev |
| Workspace membership | Member (or higher) to create Inboxes; Viewer can usually inspect |
| Any HTTP client | curl, Postman, or your partner’s webhook — no Spanline CLI required for this path |
Mental model (30 seconds)
| Surface | Role |
|---|---|
App (/capture/…) |
Where your team creates Inboxes, inspects traffic, sets mock responses |
Catch URL (/i/…) |
Where partners and test clients send HTTP — no sign-in |
They are different addresses on purpose. Share only the catch URL with external systems.
Step 1 — Pick the workspace
- Sign in at app.spanline.dev.
- Use the header workspace switcher so you are in the workspace your team uses for debugging.
- Open Capture in the product rail.
If you have no Inbox yet, Spanline may create one when you open Capture. You can also choose New Inbox from the context bar.
Step 2 — Create (or open) an Inbox
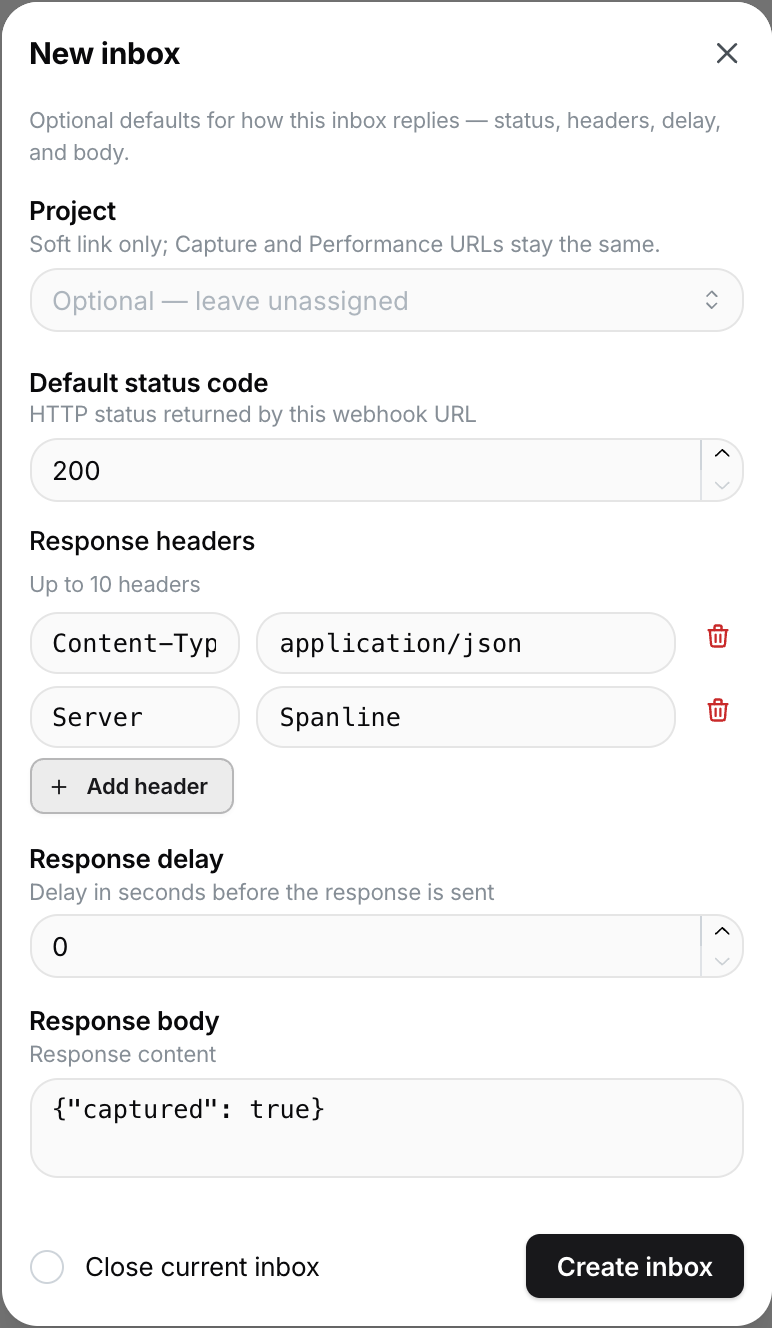
- Prefer New Inbox when you want a fresh catch URL (for example a dedicated partner sandbox).
- Optionally set the default mock response and link a Project in the product.
- After create, stay on
/capture/<inbox-id>and find the catch URL in the context bar (or Help).
Treat the catch URL like a webhook secret. Prefer HTTPS and avoid posting it in public channels — see Privacy & safety.
Step 3 — Send a test request
Copy the catch URL, then send traffic with any HTTP client. Production host examples:
curl -X POST "https://api.spanline.dev/i/<your-inbox-id>" \
  -H "Content-Type: application/json" \
  -d '{"hello":"world"}'
On an empty Inbox you can also use Send test or a snippet from the listen hero:
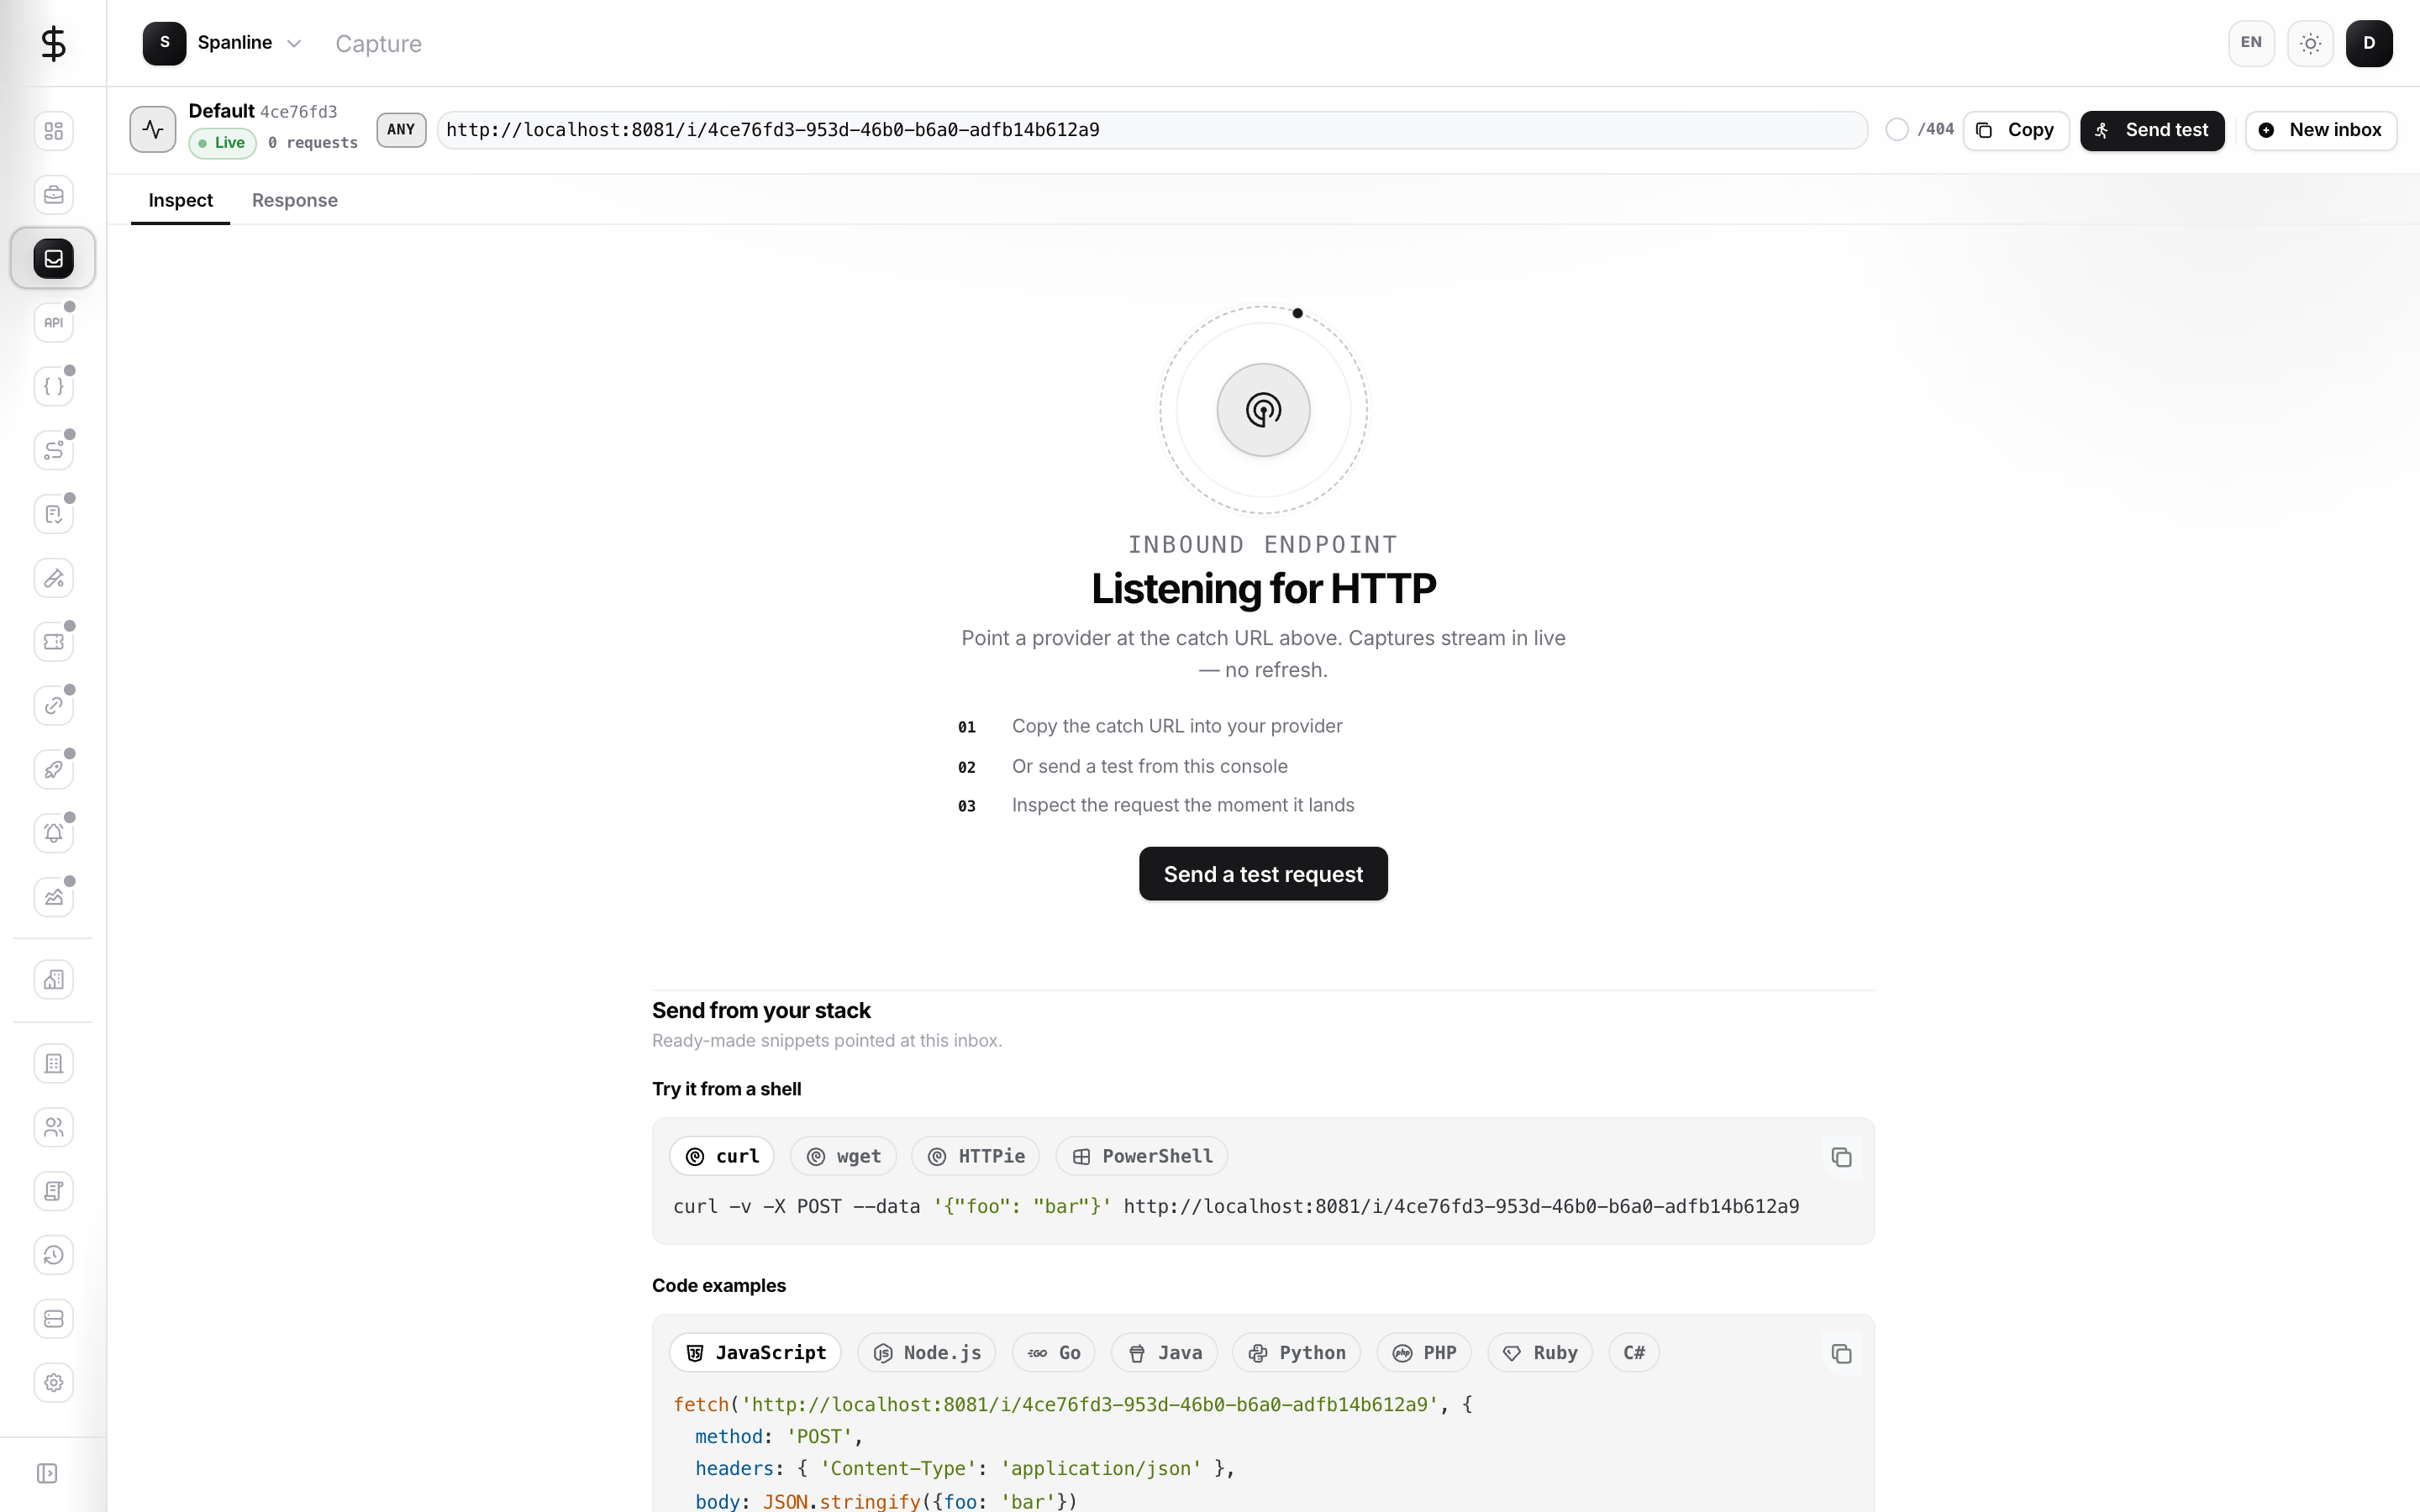
You usually do not need to refresh — new requests appear live in the sidebar.
Step 4 — Inspect the request
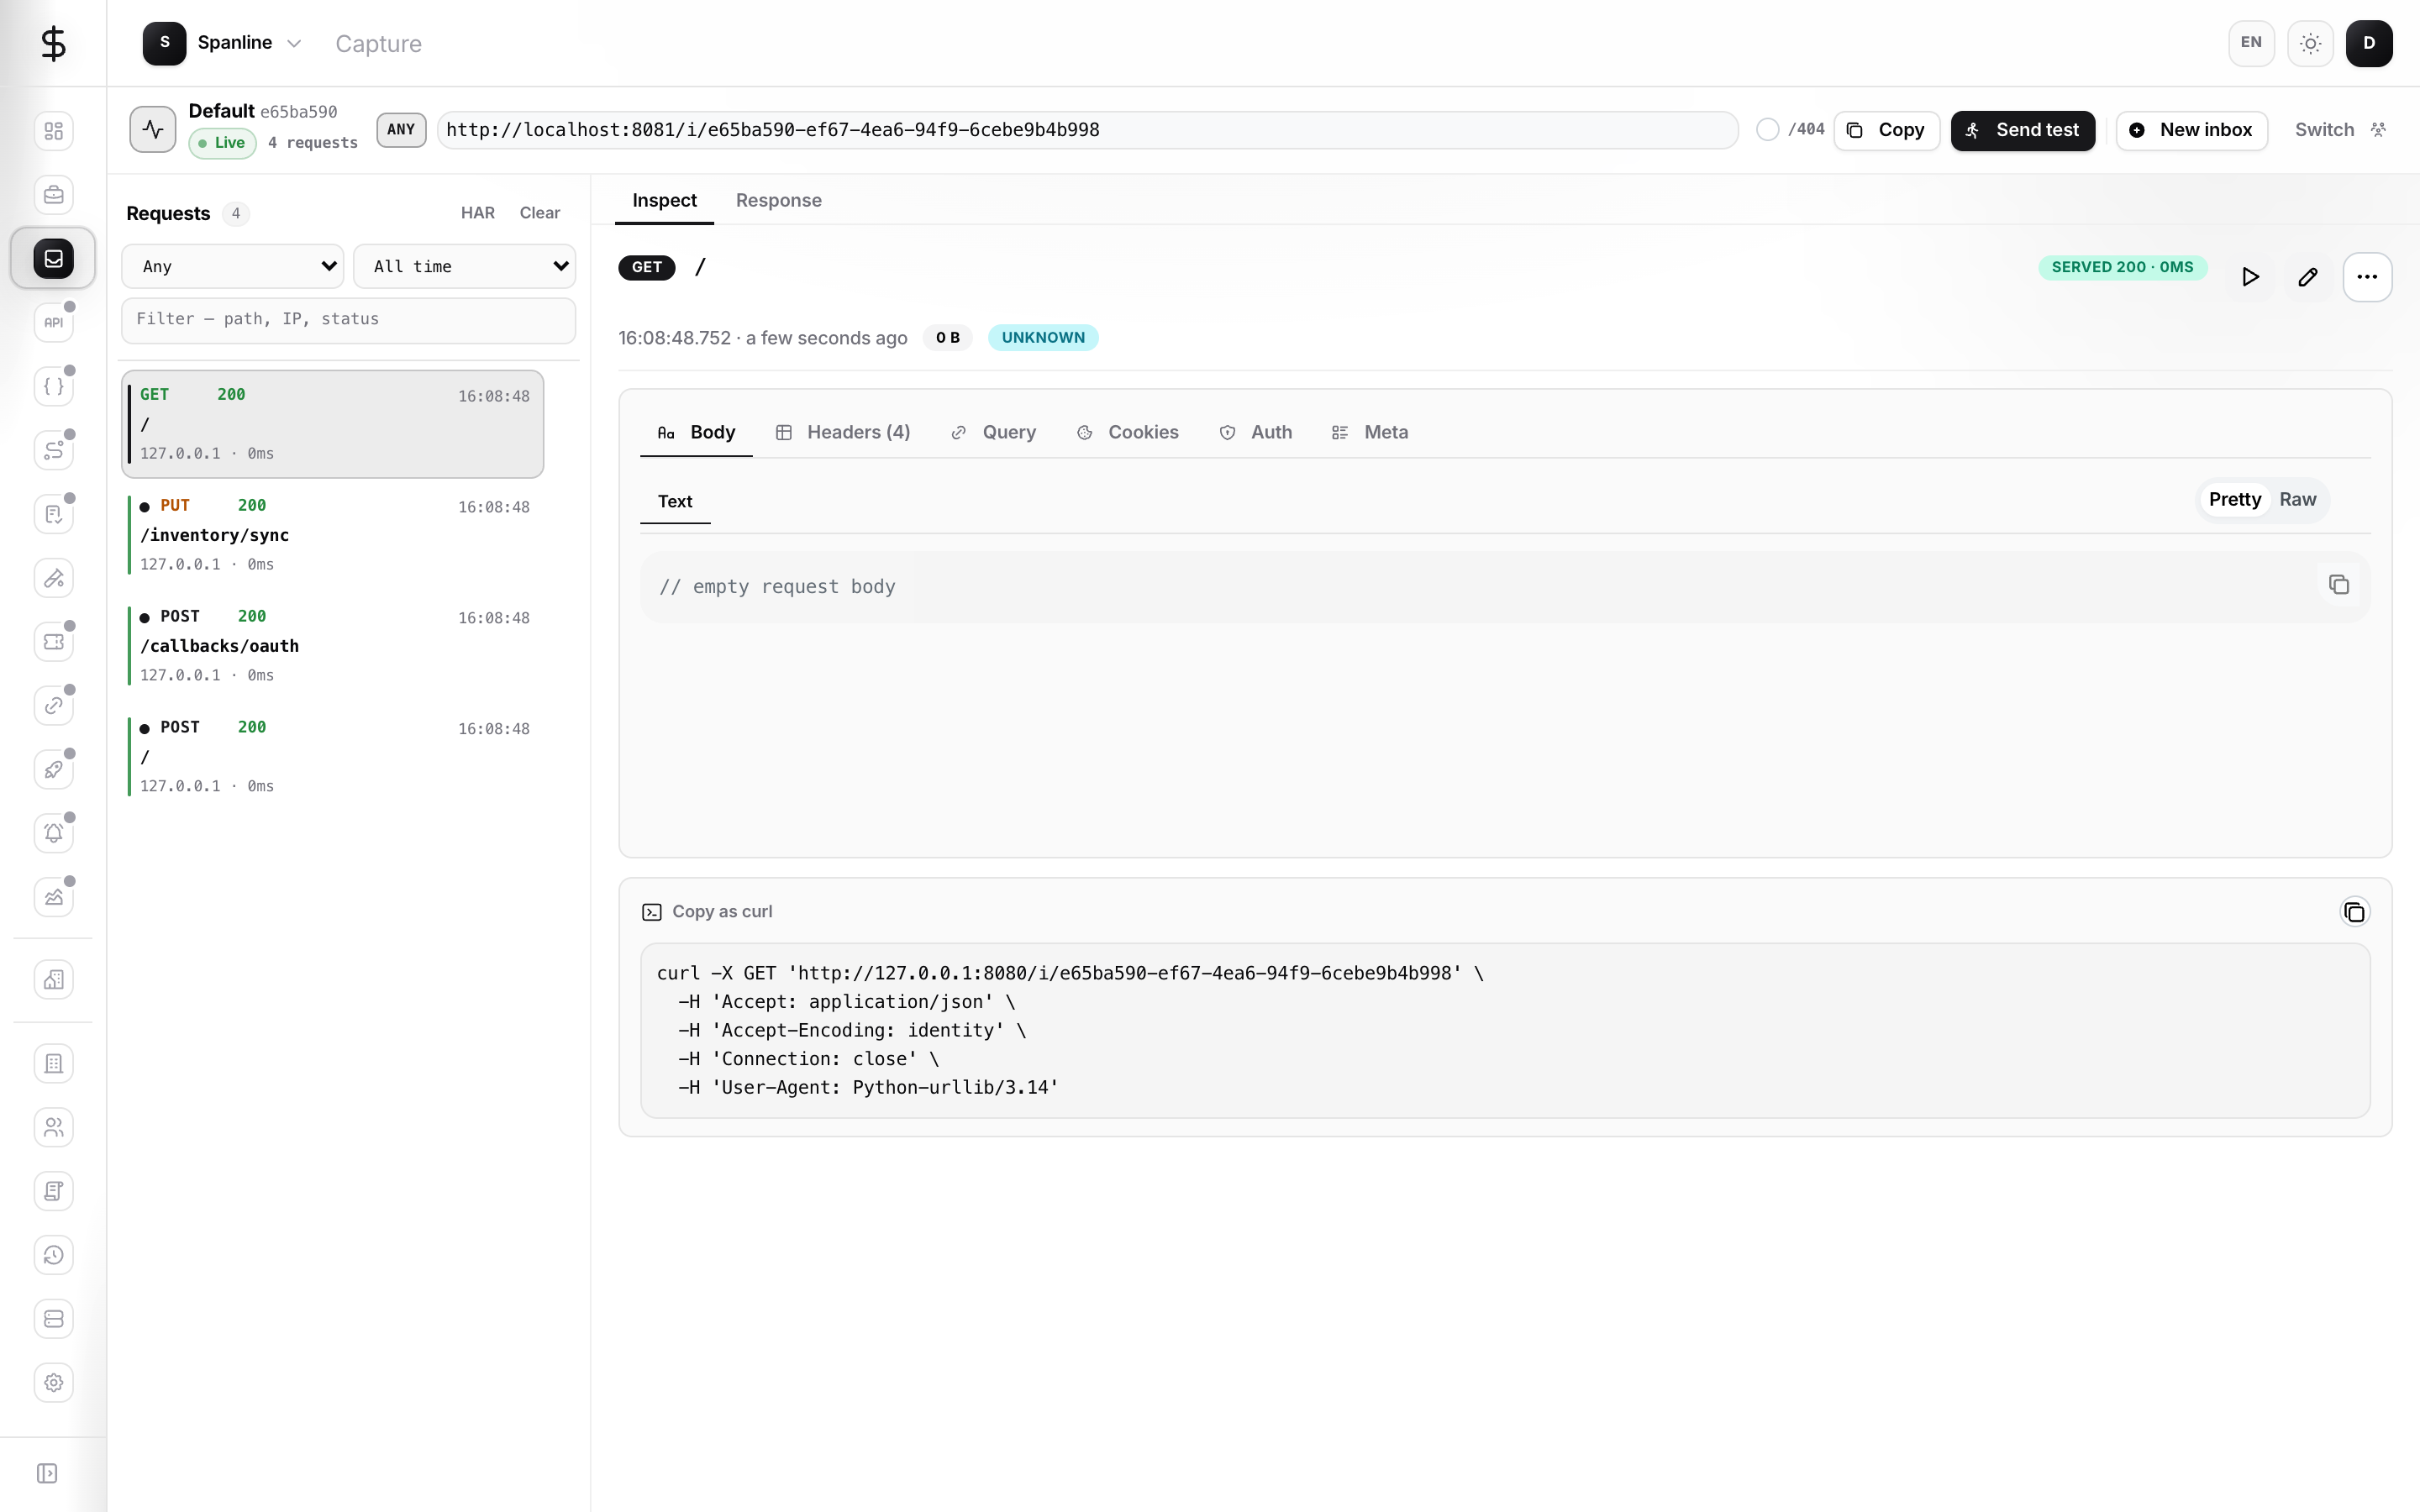
- Select the new request in the sidebar (or open
/capture/<inbox-id>/<request-id>). - Use the inspector tabs: Body, Headers, Query, Cookies, Auth, Meta.
- Confirm method, headers, and body match what you sent.
Step 5 — Optional: set a mock response
Open the Response tab if callers should receive a predictable status, headers, body, or delay while you debug. Presets cover common cases (JSON 200, empty 204, 401).
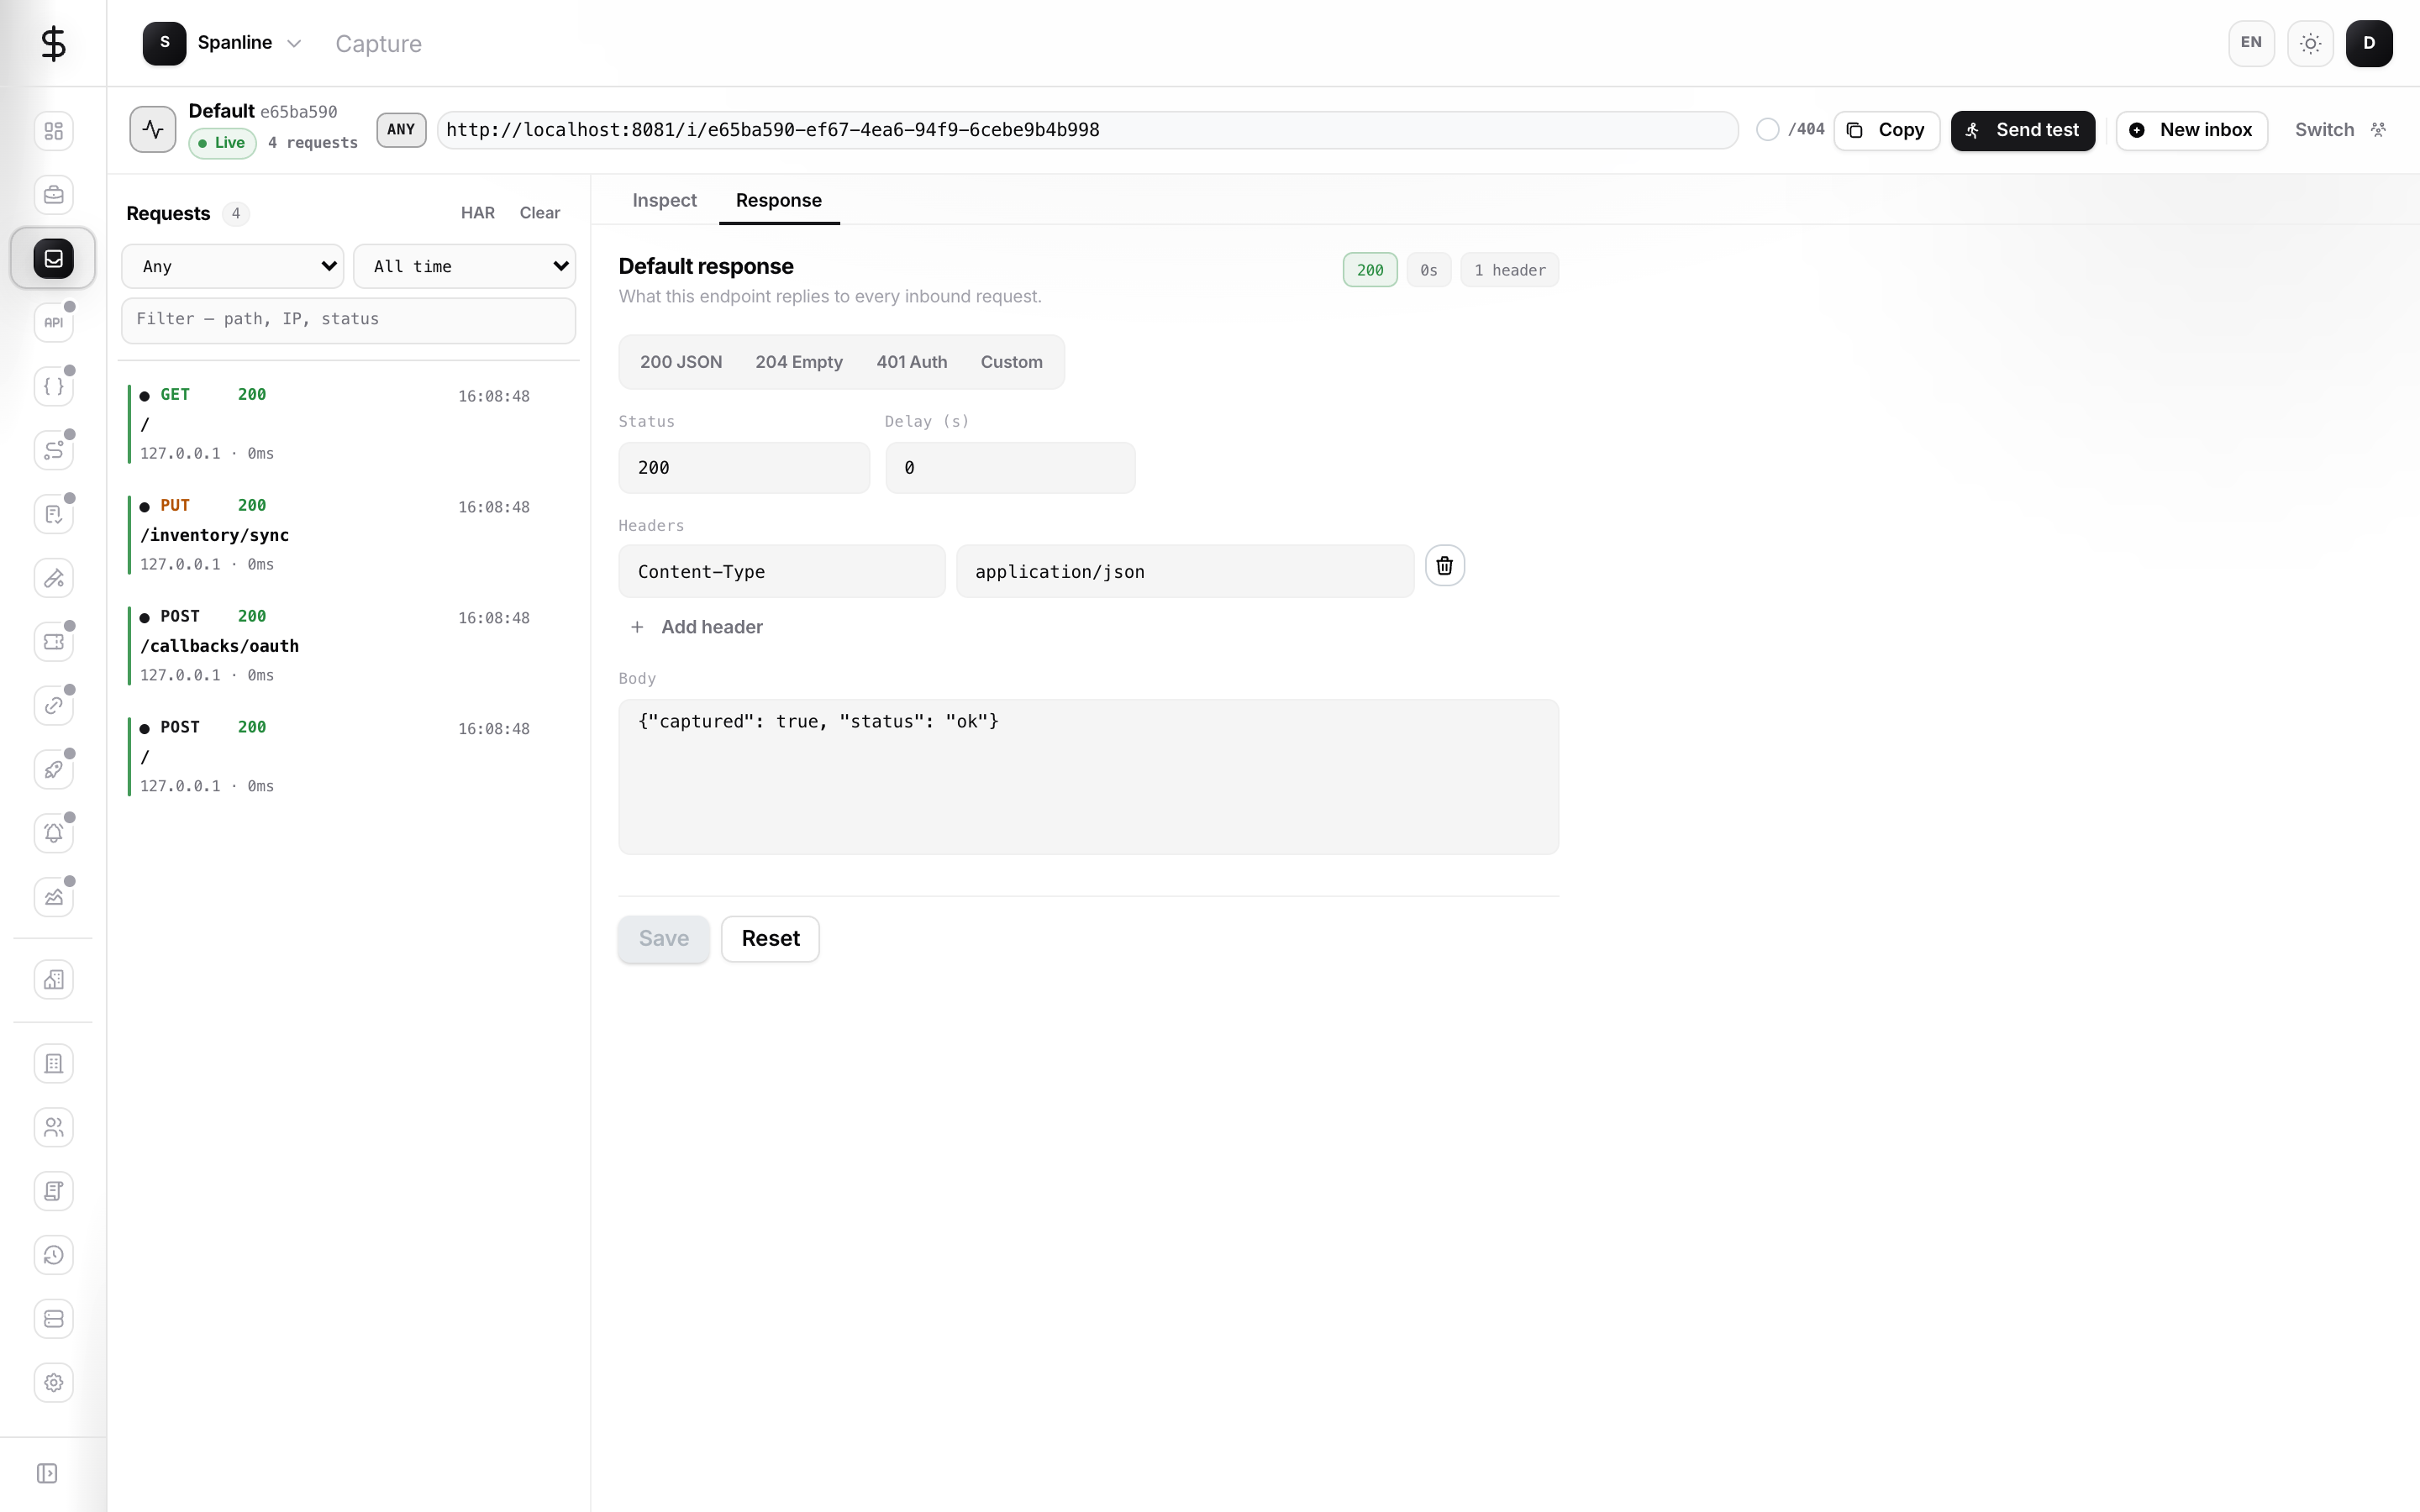
For a one-off status without changing the Inbox default, append a segment such as /404 to the catch path — see Concepts.
Checklist — first success
- [ ] You are in the correct workspace
- [ ] An Inbox exists and you copied its catch URL (
/i/…, not/capture/…) - [ ] A test
curl(or Send test) returned successfully - [ ] The request appears in the sidebar
- [ ] You can open it and read body / headers
Next steps
| Goal | Go to |
|---|---|
| Day-to-day UI (replay, compare, HAR, clean up) | Guides |
| Glossary and catch URL vs app | Concepts |
| Secrets in captures | Privacy & safety |
| Nothing arrives / wrong status / replay fails | FAQ |
Not in this guide (later)
Deep replay targeting, signature verify flows, and partner-specific webhook recipes live under Guides and FAQ. Capture does not need the Spanline CLI for first success — that is a Performance concern.