Guides
Day-to-day flows in the Spanline app. For the first smoke test, see Getting started. For runner commands, see Run tests.
Prepare an environment
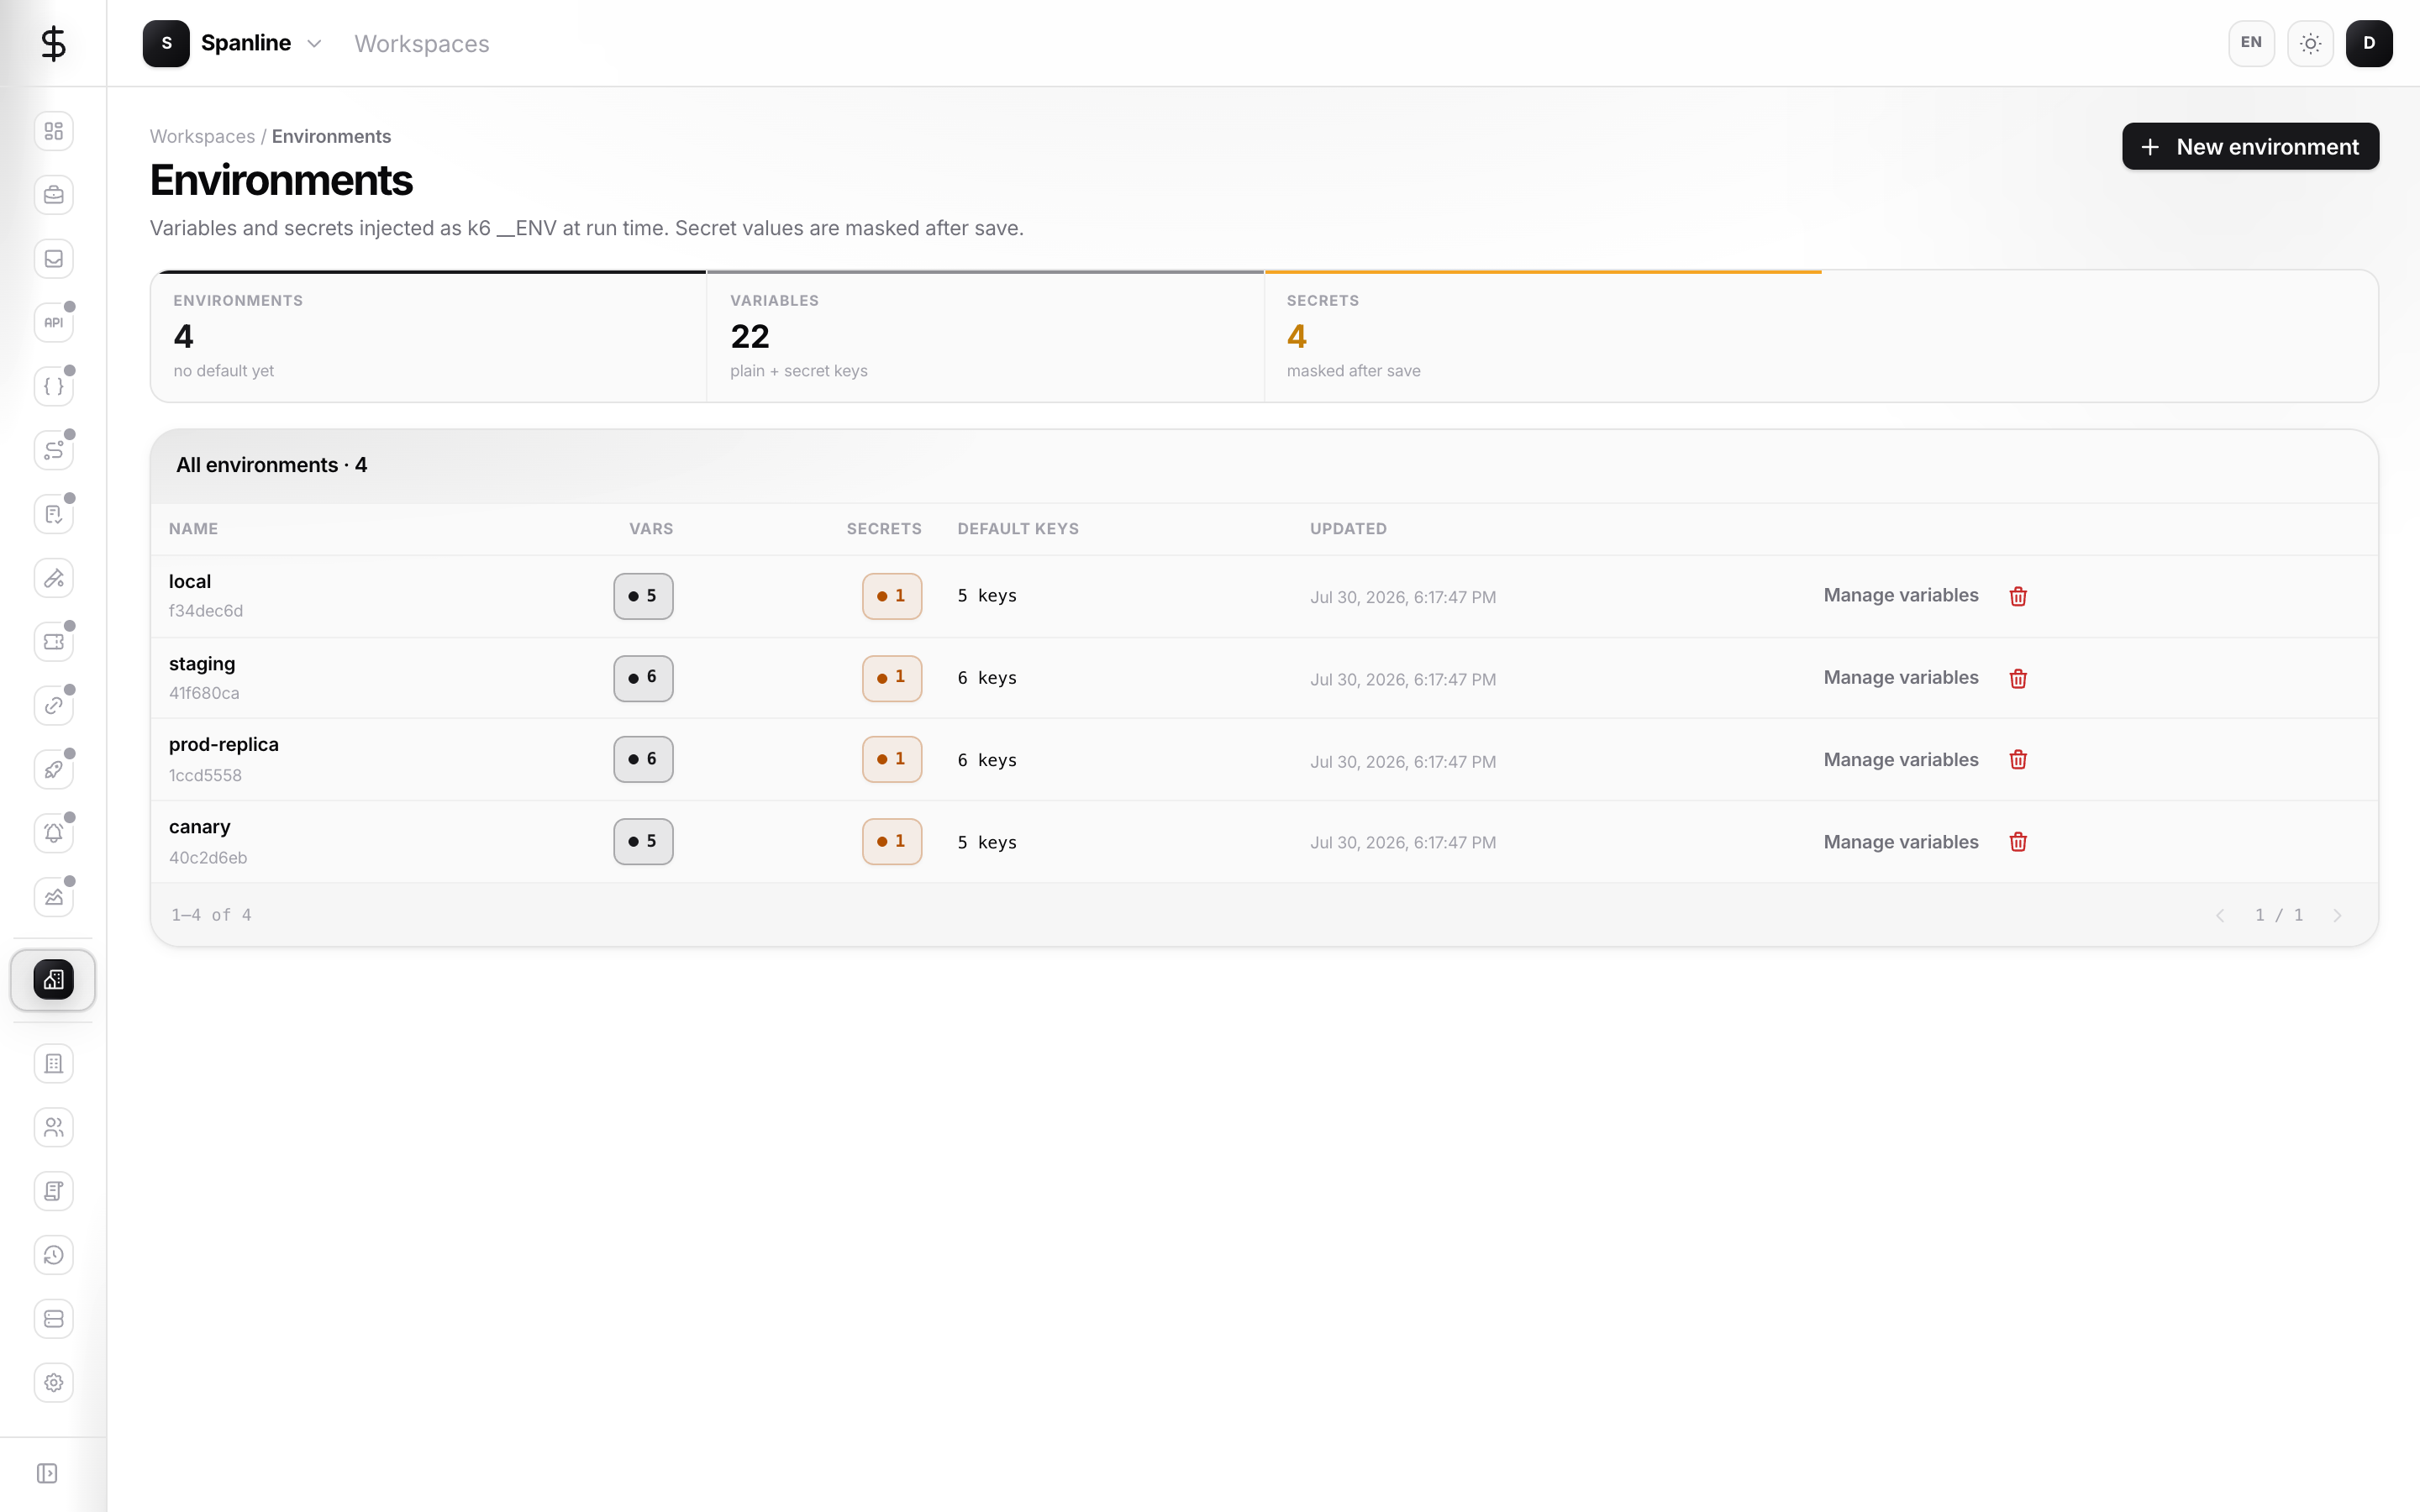
Environments live under the workspace, not inside the Performance rail.
- Open Workspace → Environments (
/workspaces/environments). - Create an environment and add variables your scripts need (
BASE_URL, tokens, and similar). - Mark sensitive values as secrets. When your organization uses sealed secrets, the app encrypts those values so they are not stored in plain text — see Access & secrets.
Create a scenario
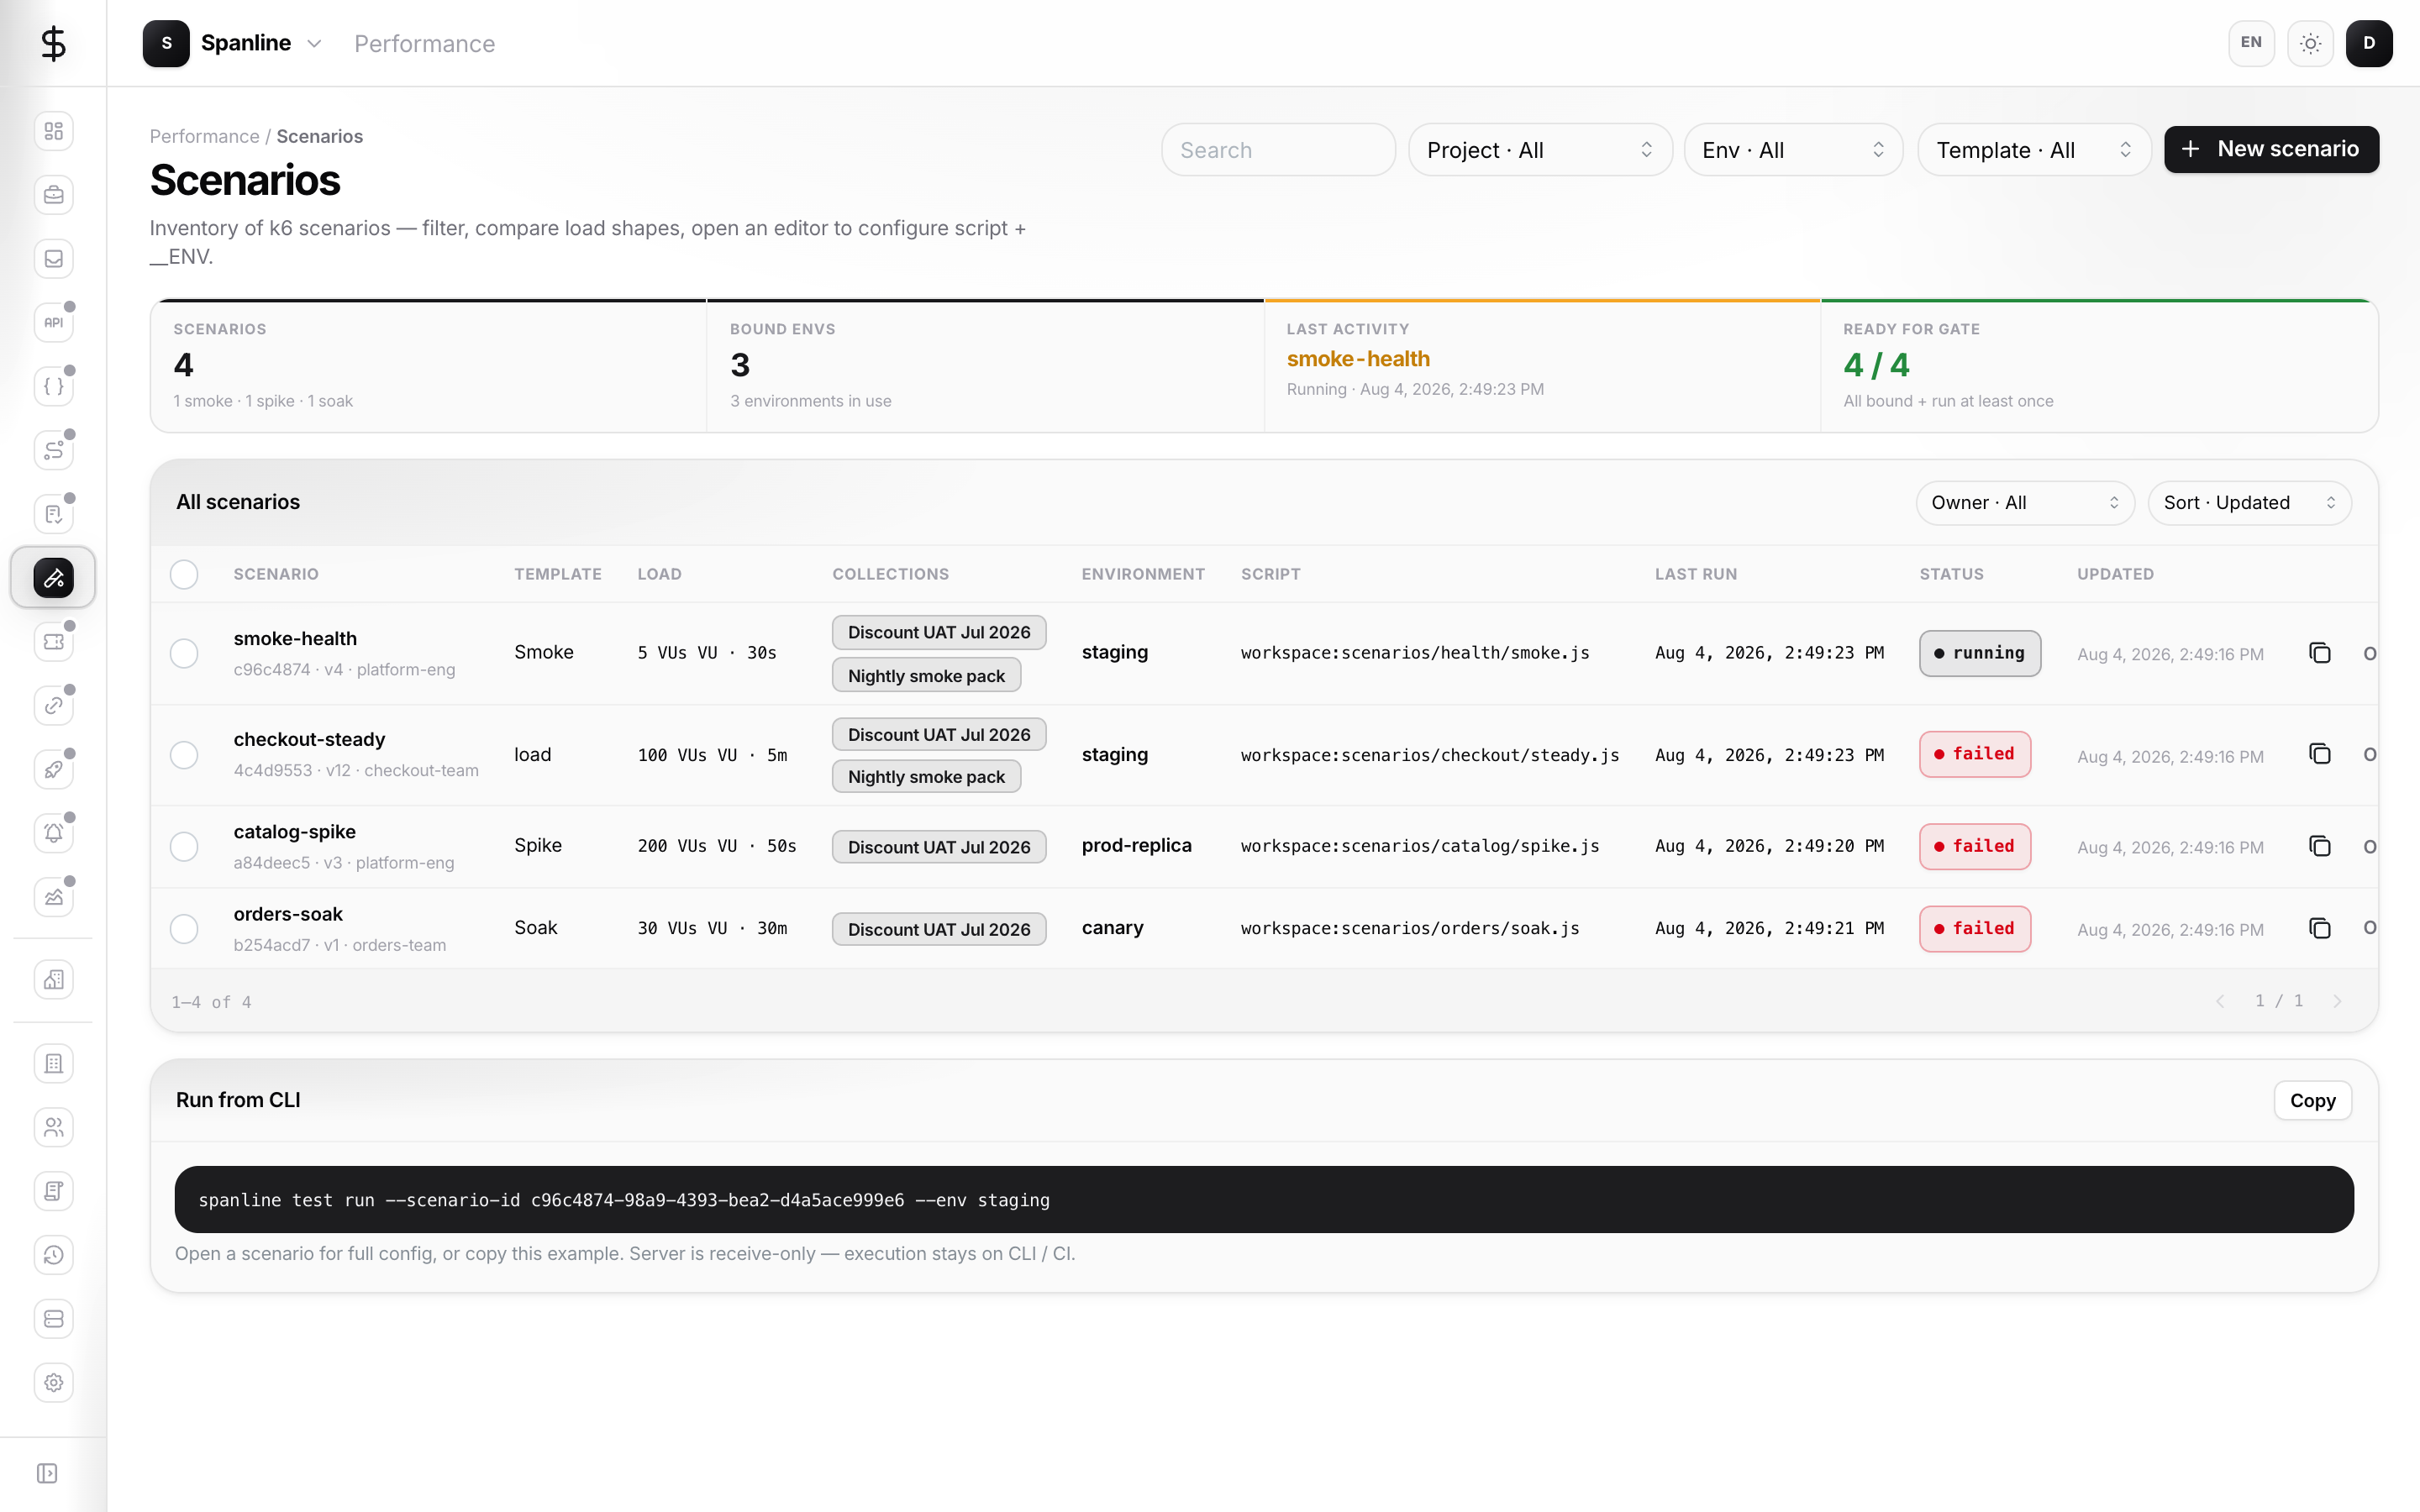
- Open Performance → Scenarios.
- Choose New scenario, or use a template from the empty state (Smoke, Steady, Spike, Soak) when the catalog is empty.
- Set a clear name, paste your k6 script (or keep the template), configure options/stages/thresholds as needed, and attach an environment.
- Optionally link a Project in the editor so the toolbar project filter can narrow lists.
Sync from disk (CI / local-first) is done with the CLI (--sync --name), not from a button in the editor.
Catalog tips
| Control | What it does |
|---|---|
| Search / Env / Template / Owner | Narrow the list |
| Project · All (toolbar) | Personal filter for this browser; not a global header setting |
| Copy CLI (row) | Copies spanline test run --scenario-id … |
| Checkbox + Add to collection | Bulk-add selected scenarios into a collection |
| After save | “Next in the chain” offers copy CLI, add to collection, or open last run |
Scenario editor tabs
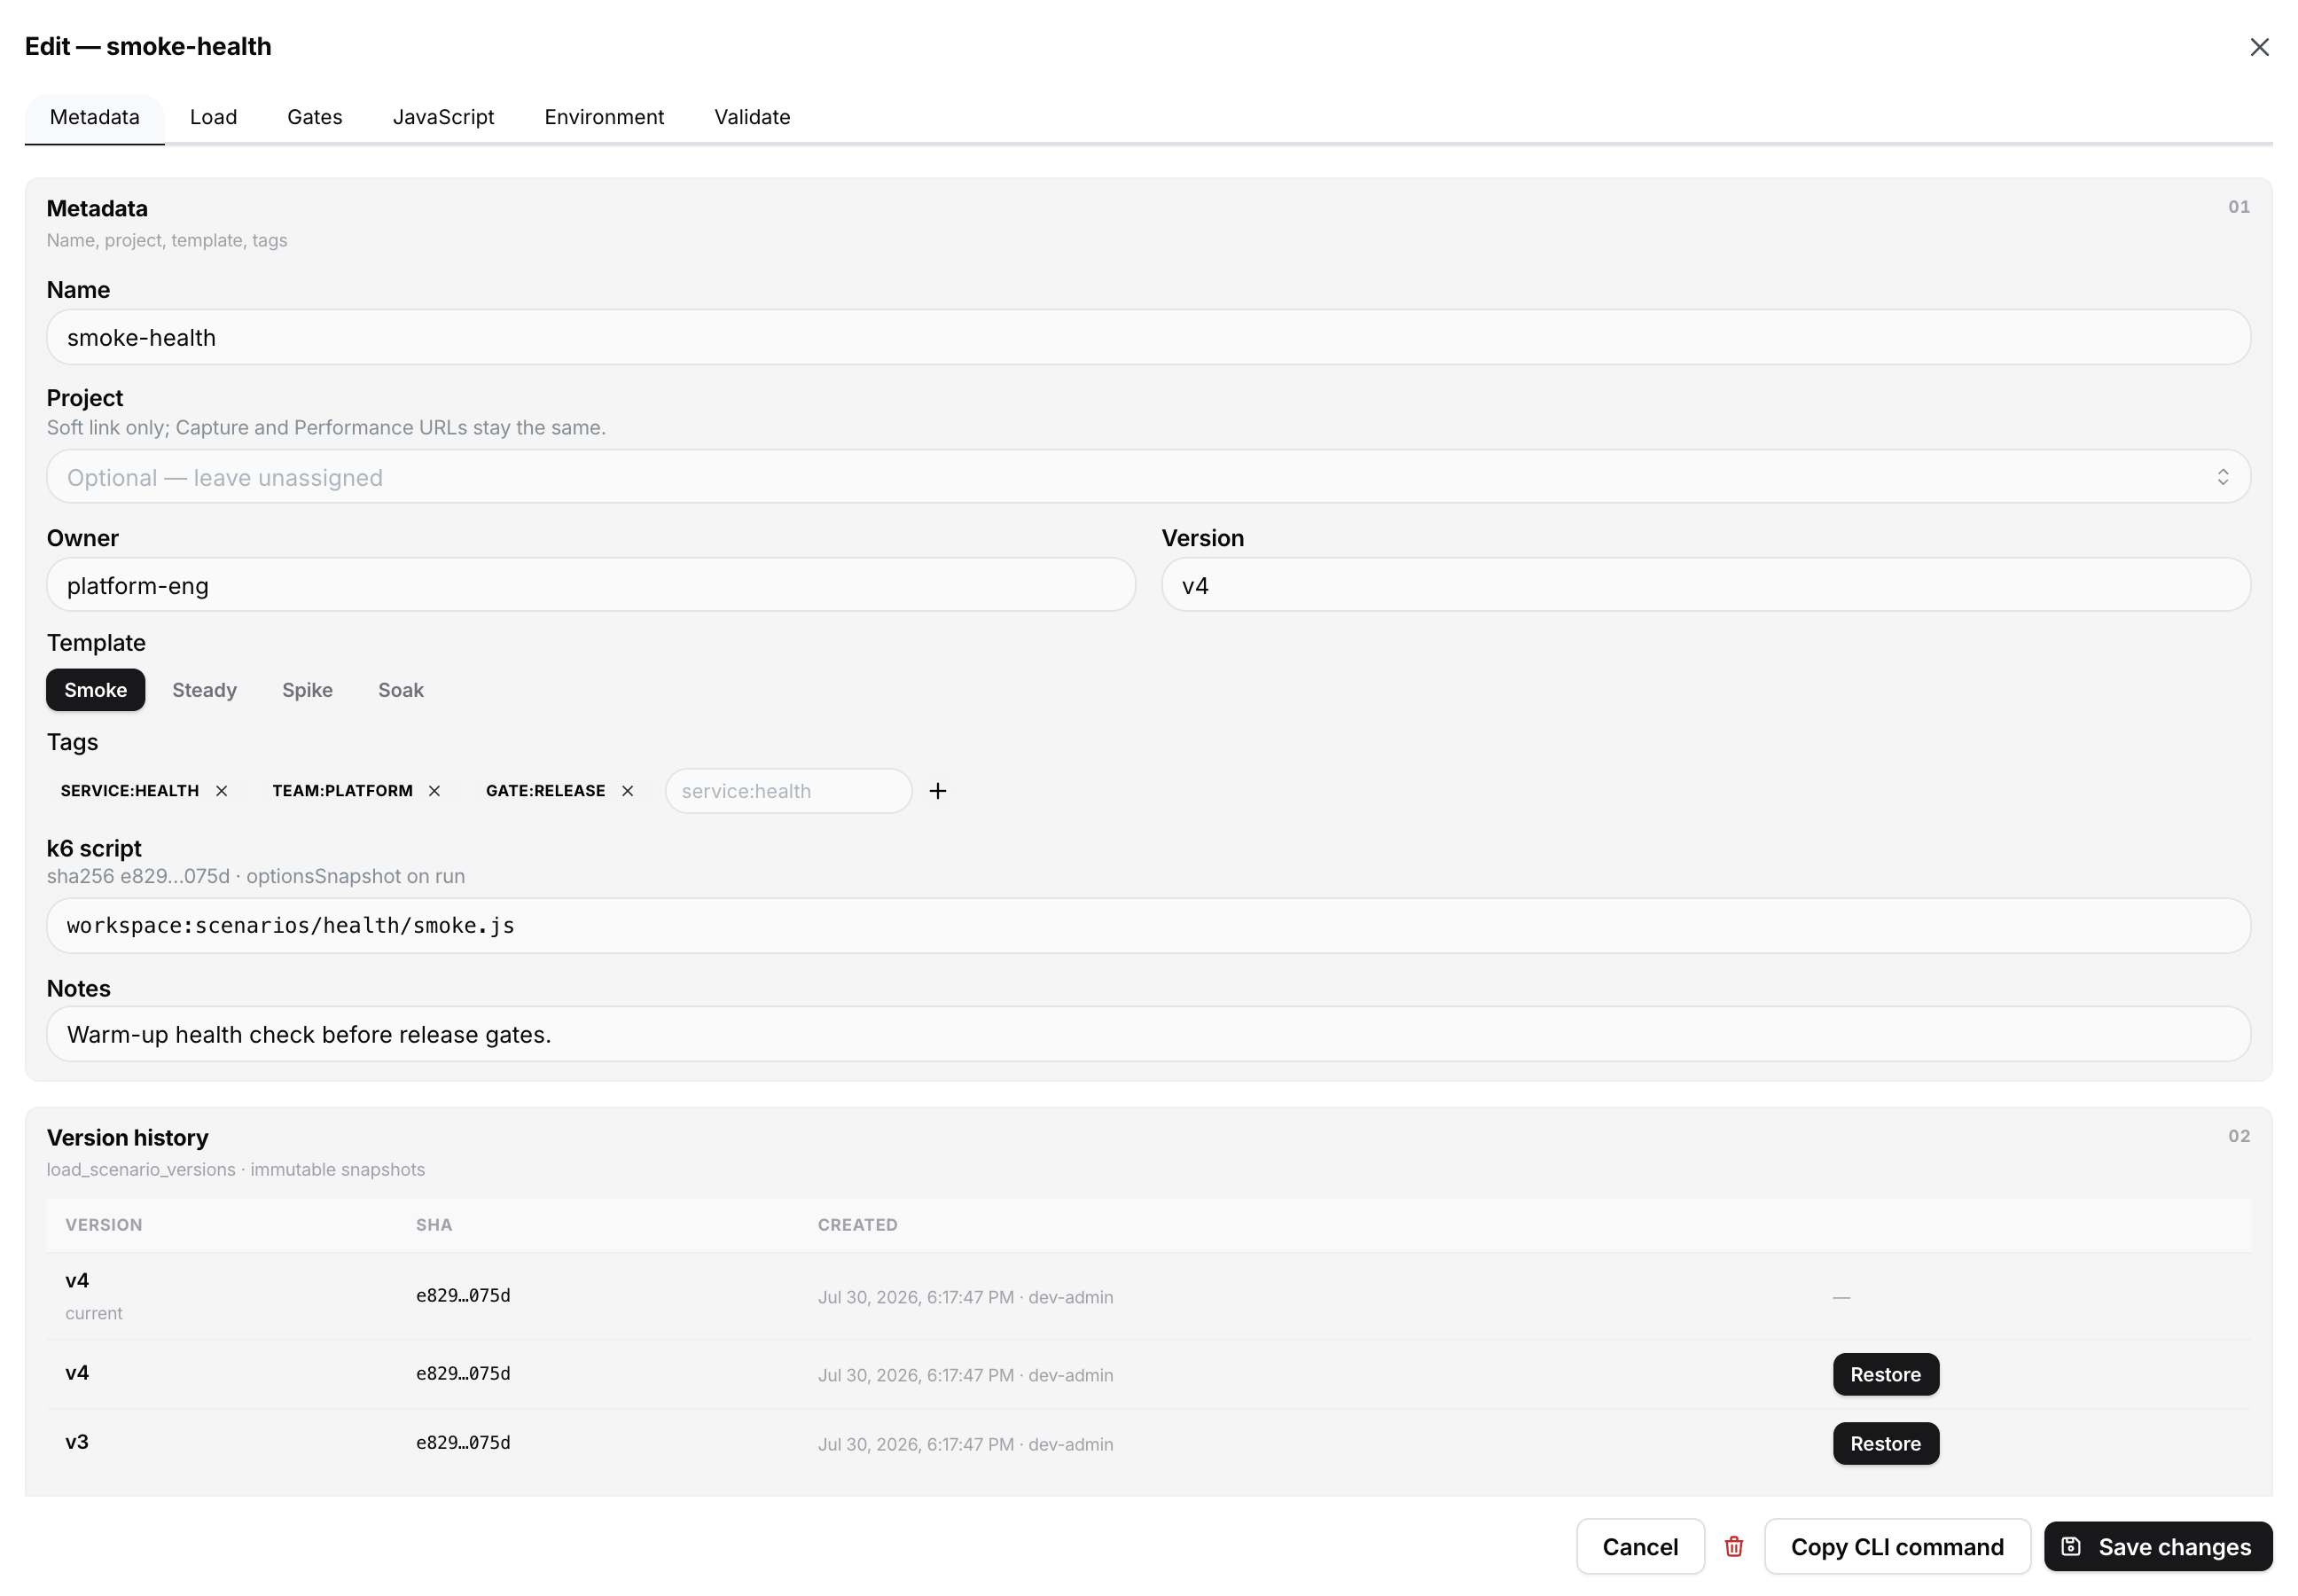
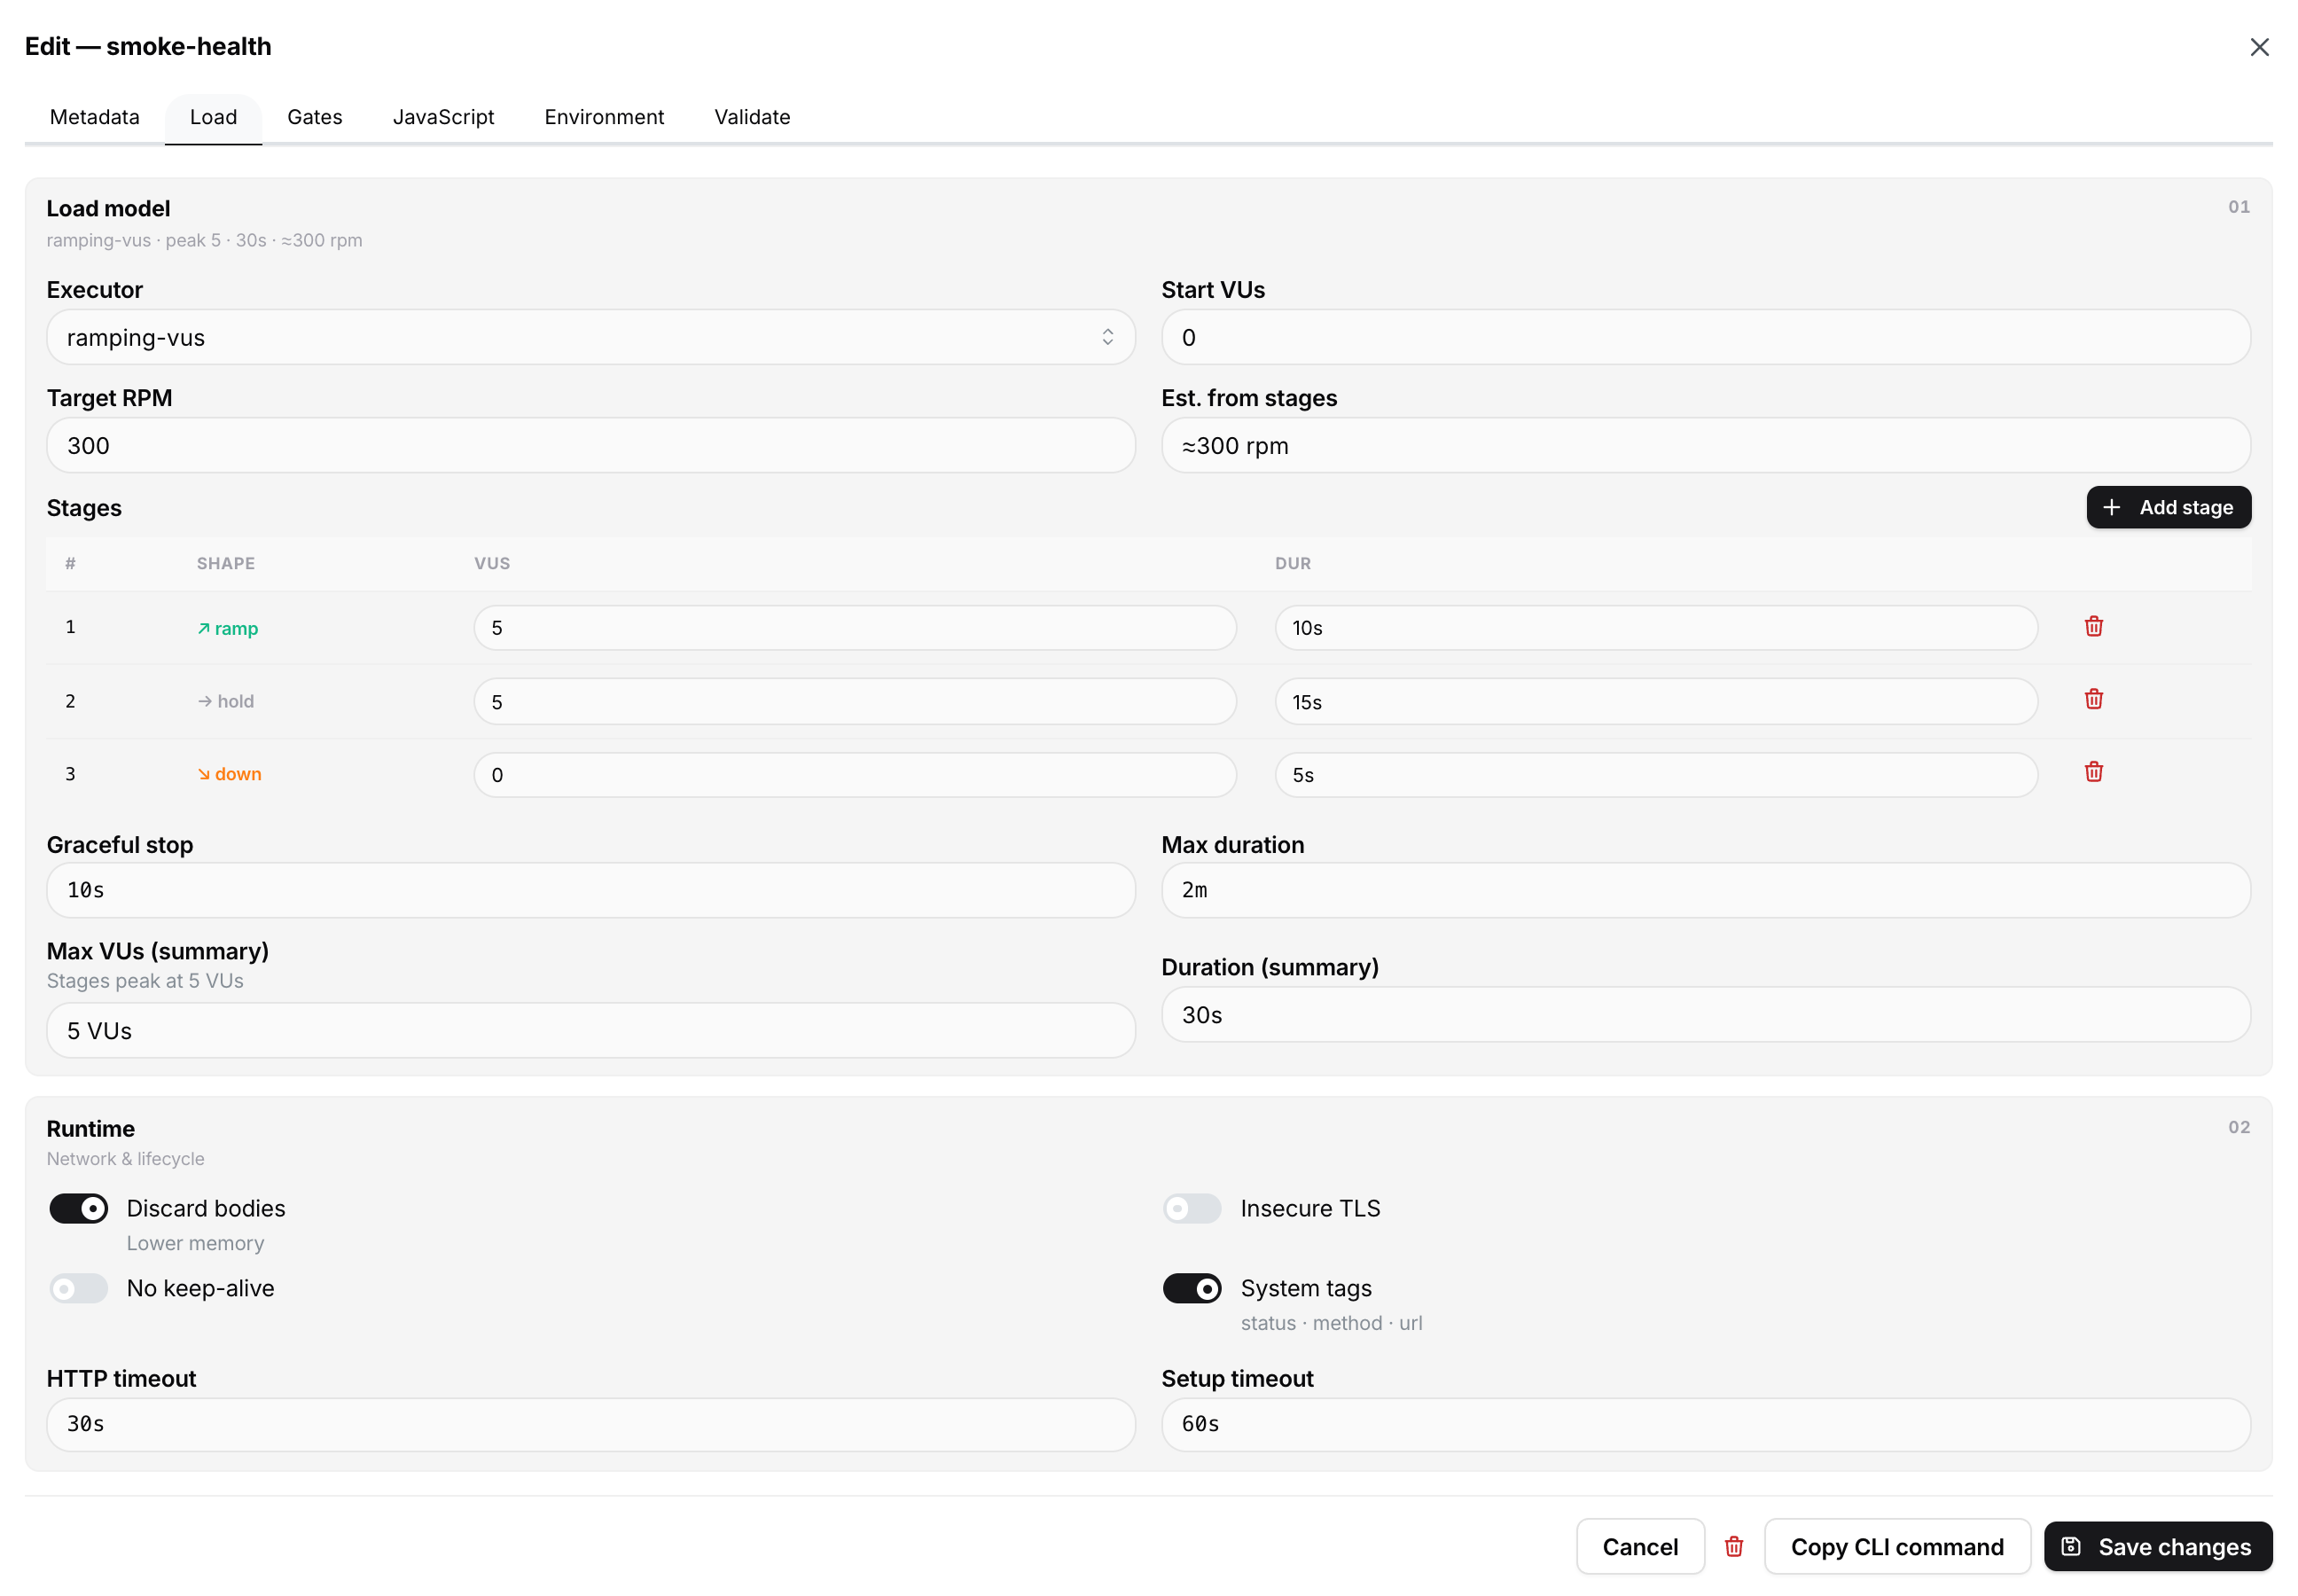
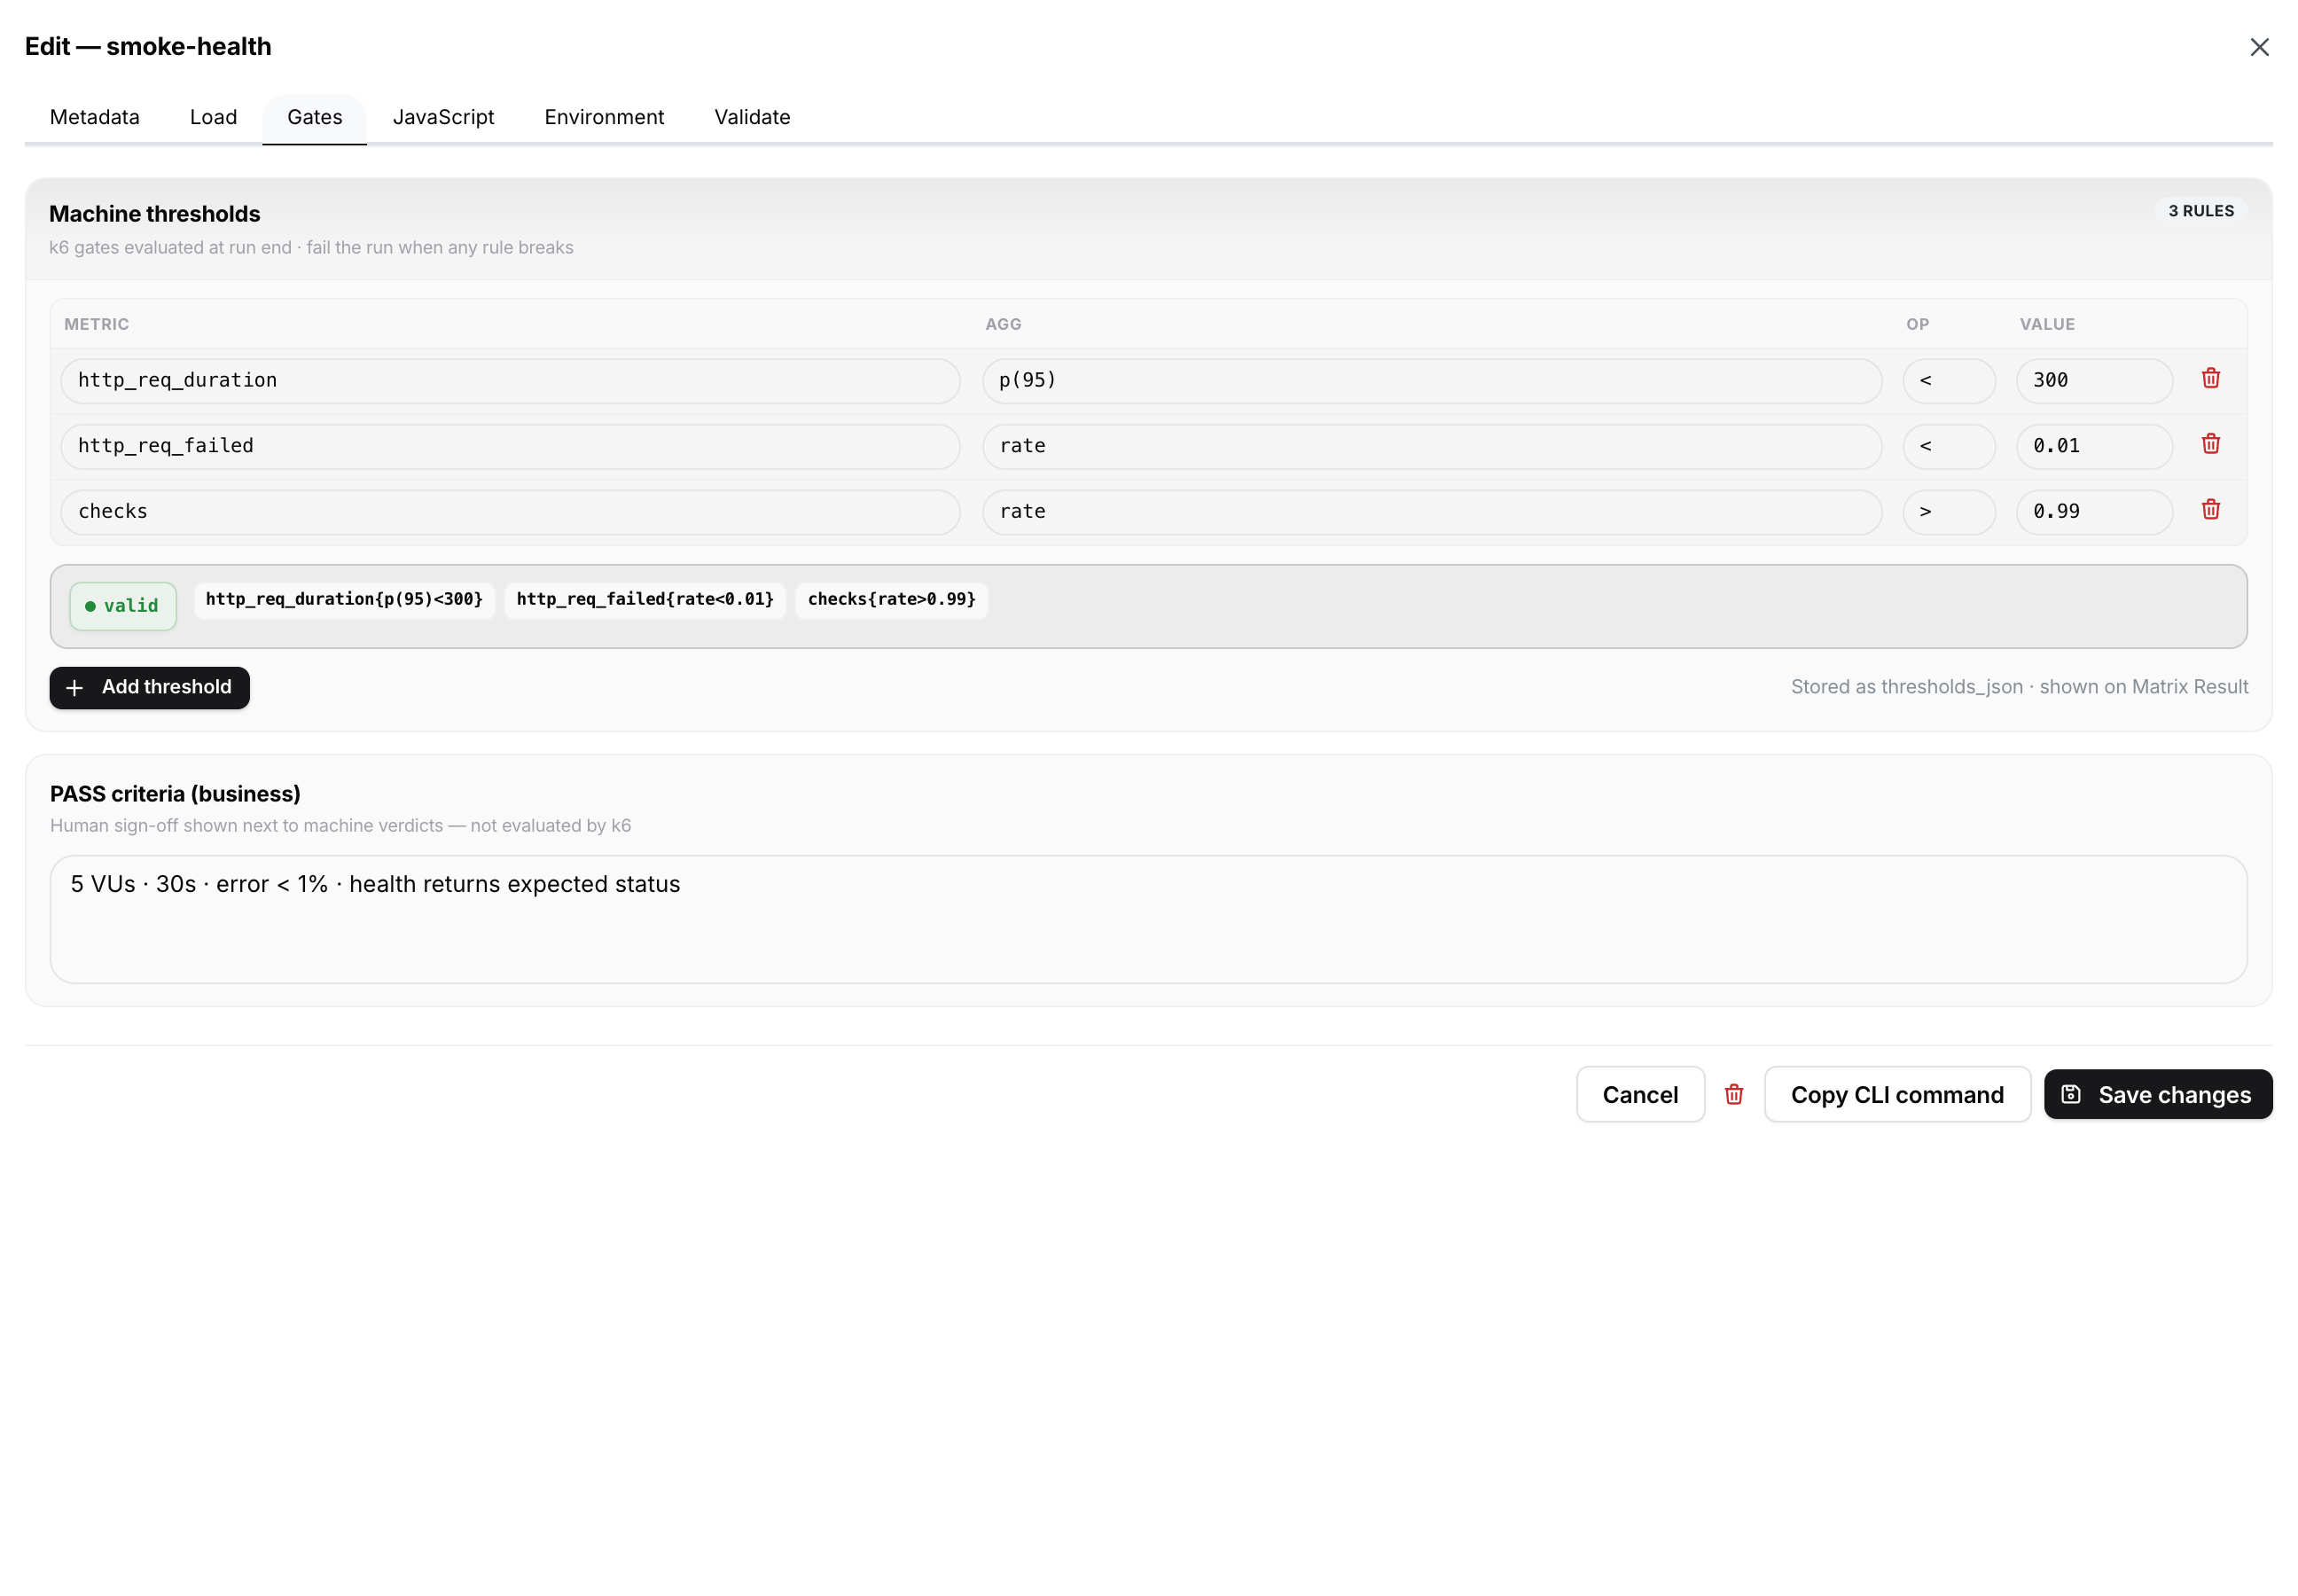
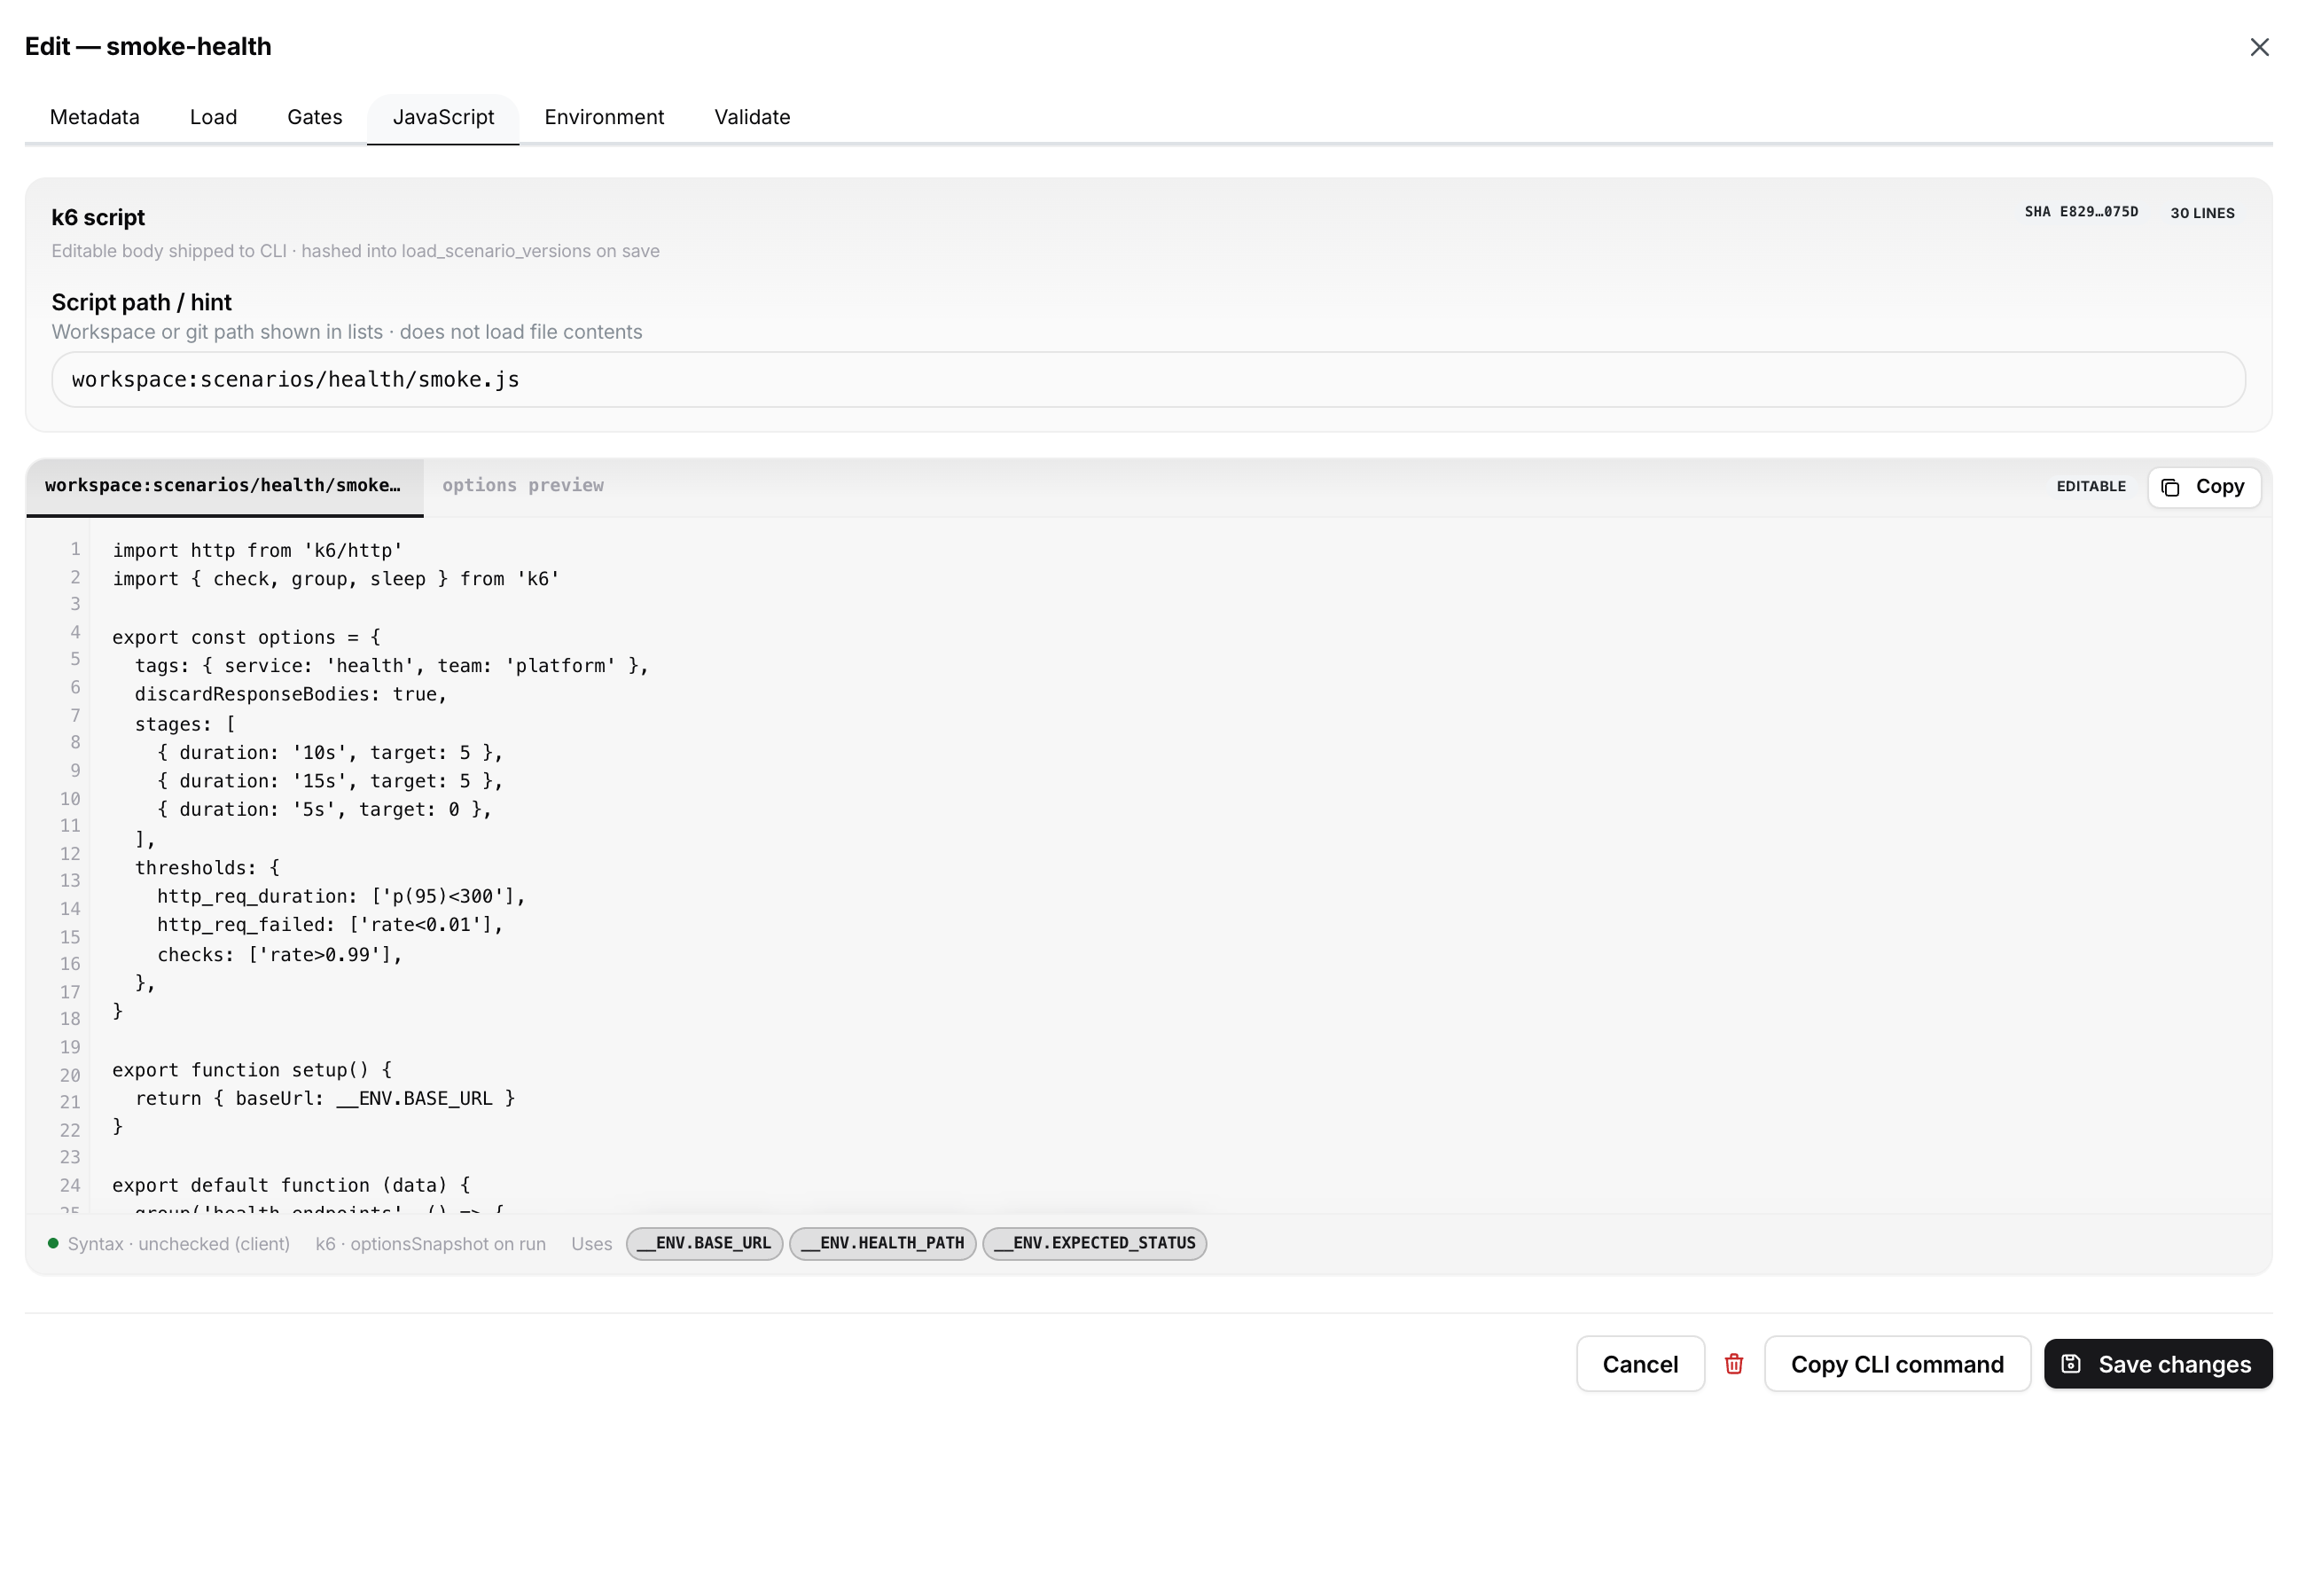
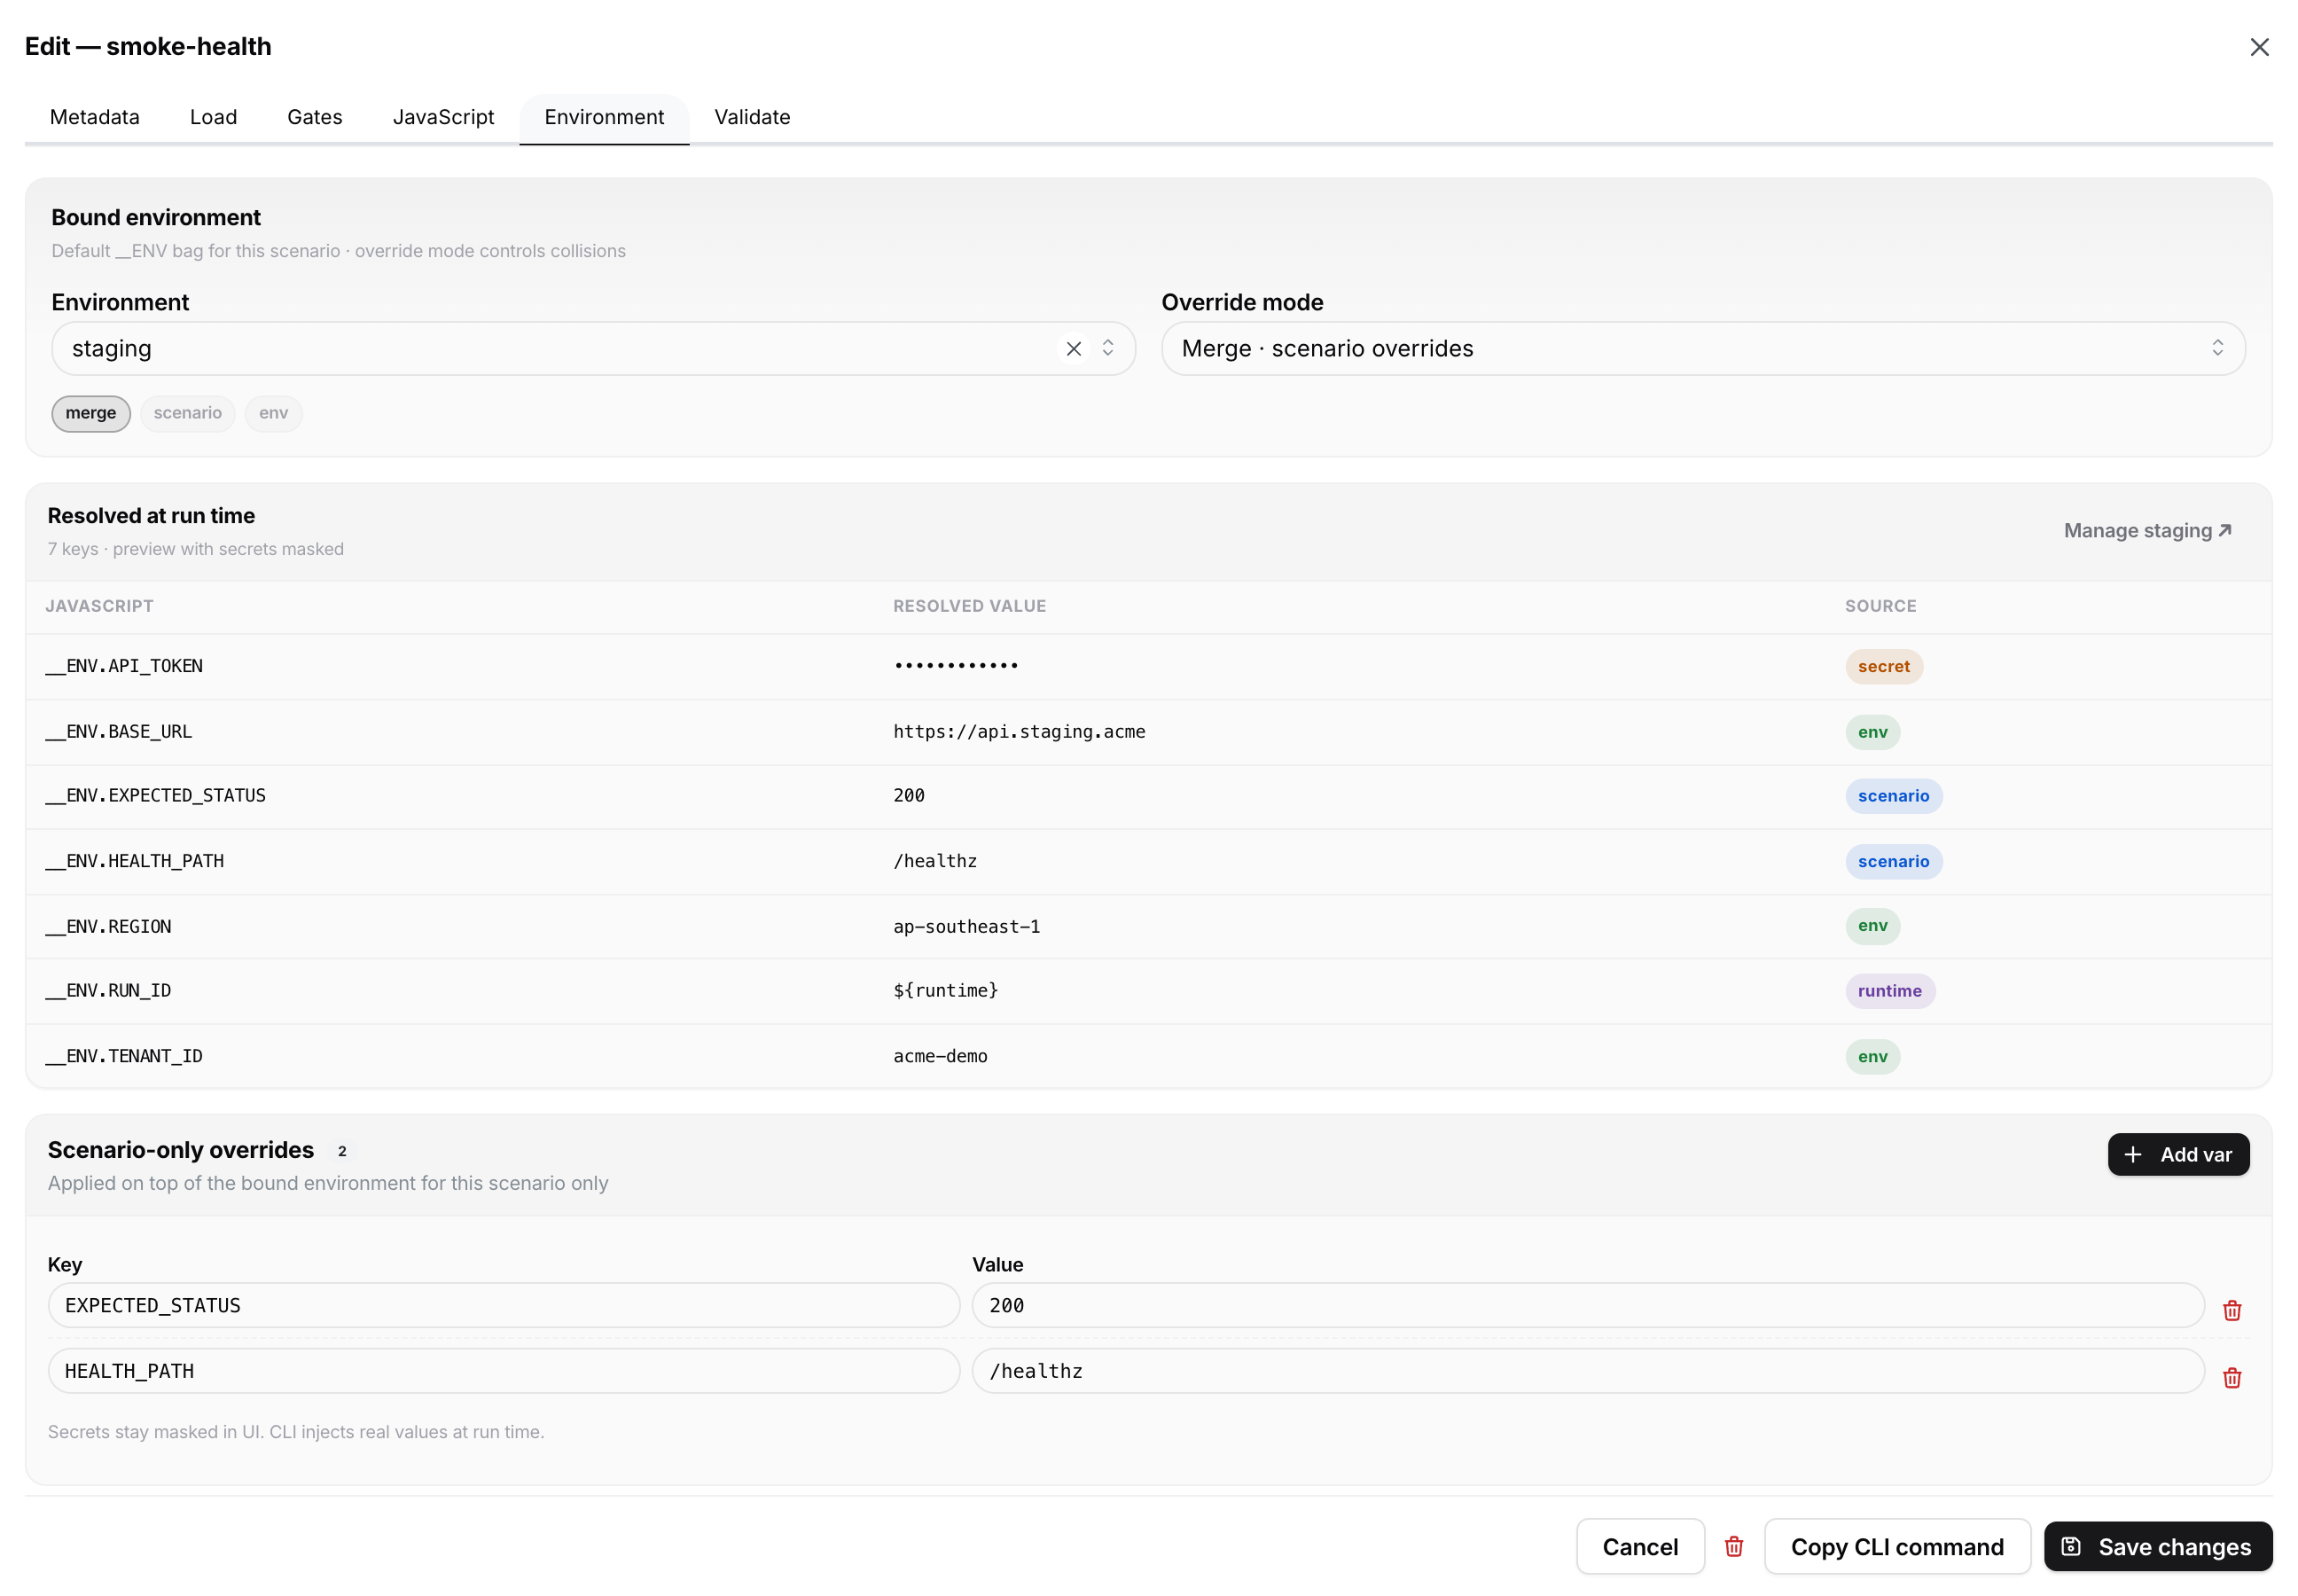
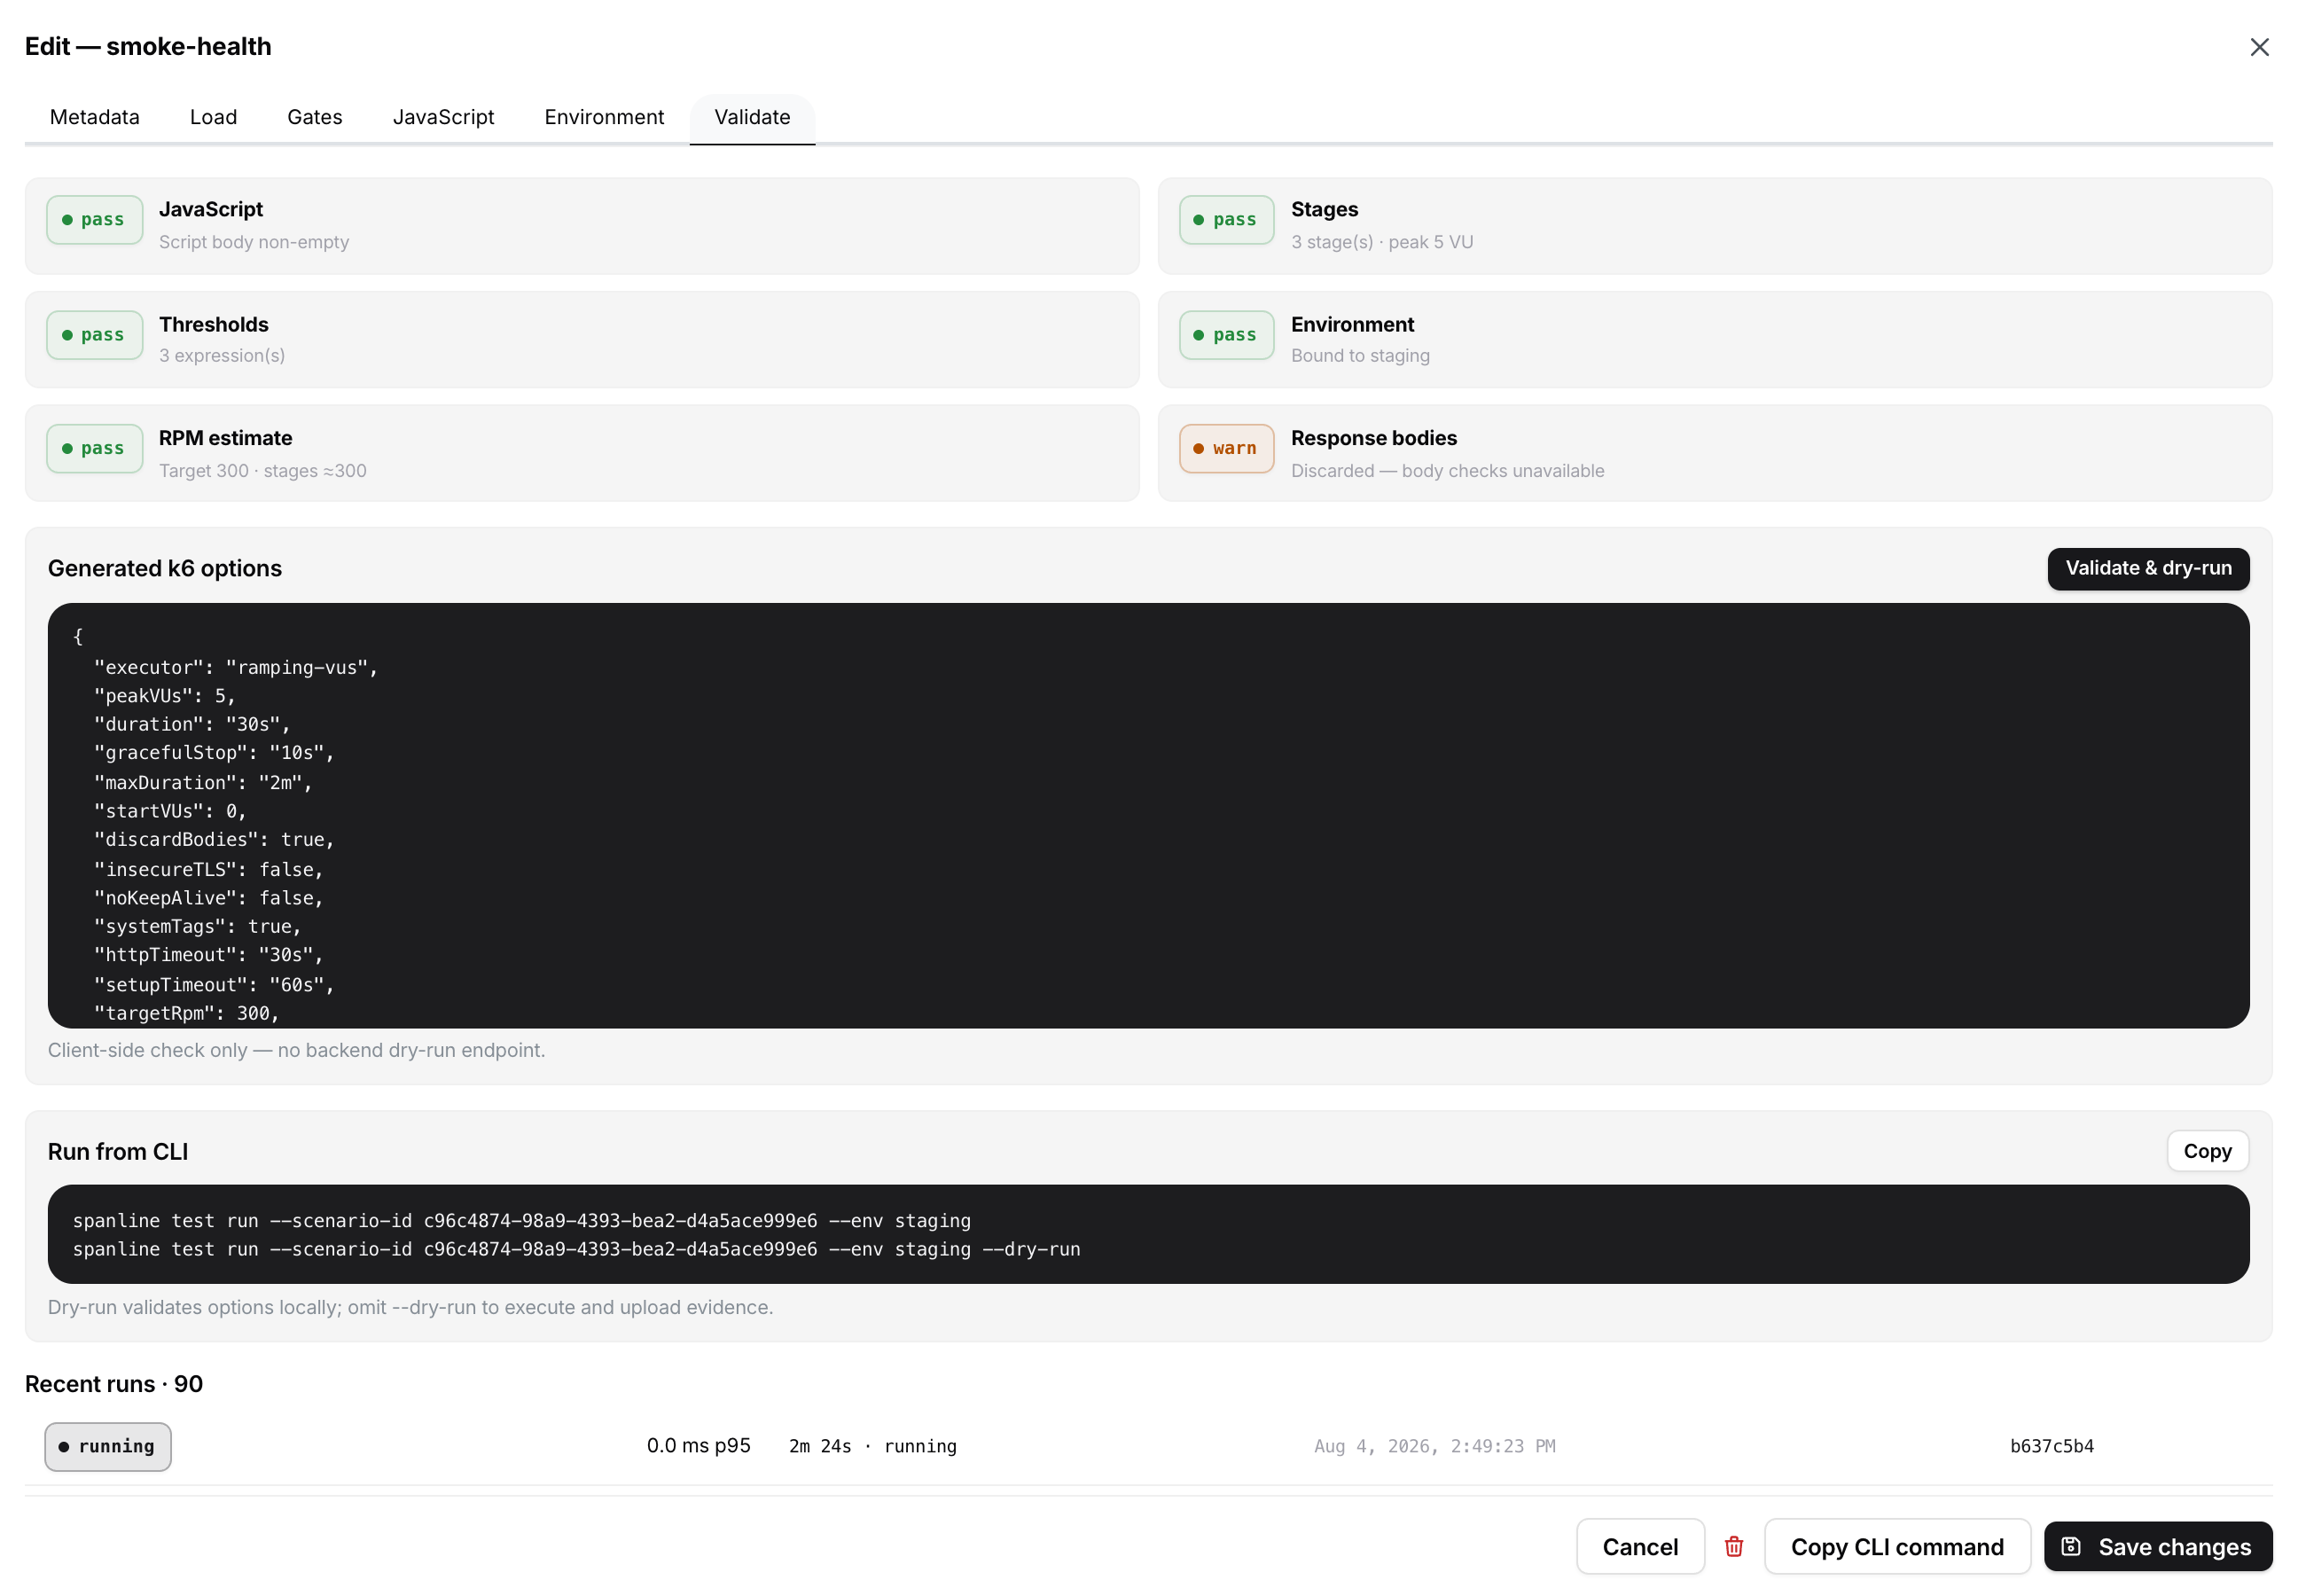
Open a scenario (Edit) to configure it across tabs:
| Tab | What you set |
|---|---|
| Metadata | Name, project, tags, notes, version history |
| Load | Executor, stages (ramp/hold/down), graceful stop, runtime toggles |
| Gates | Thresholds / check gates for pass-fail |
| JavaScript | k6 script and options |
| Environment | Linked environment, variable preview, override mode |
| Validate | Client-side dry-run checks before you save |
Version history
On Metadata, the version history table lists script snapshots. Restore loads an older snapshot into the editor draft; Save writes a new version. Pin a version from the CLI with --version-id when you need a known script for a release gate.
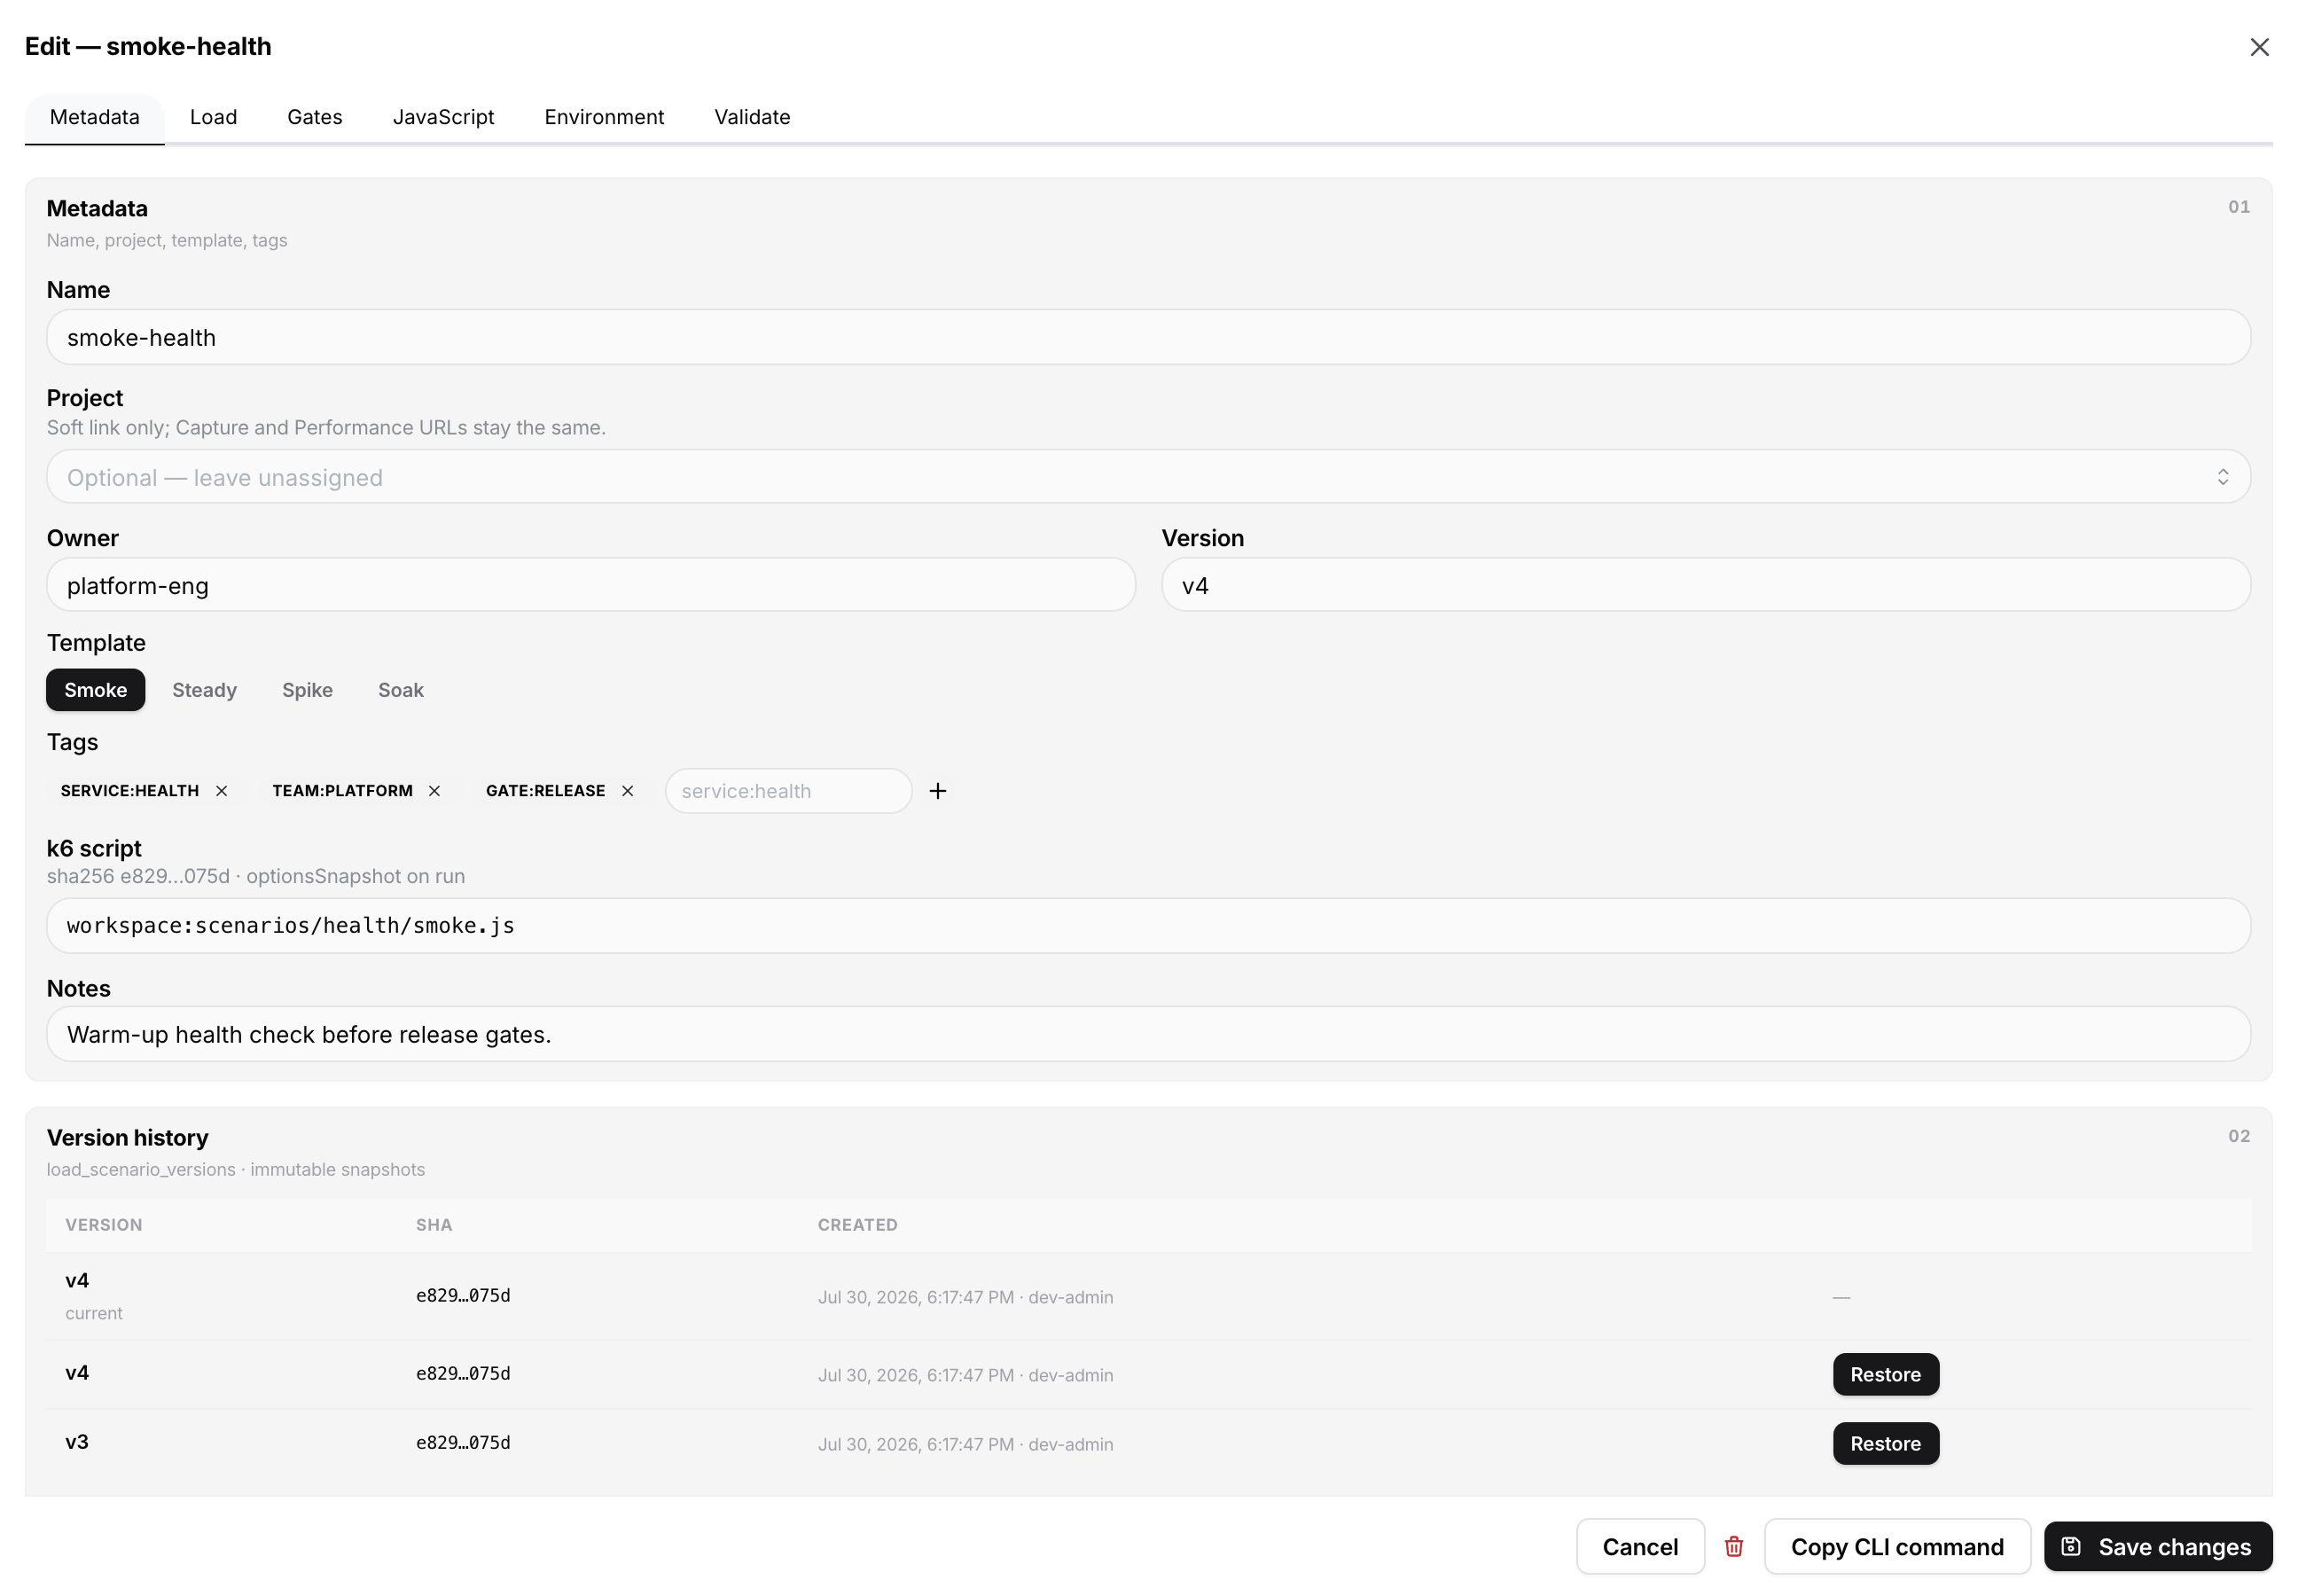
After save, copy the scenario id from the UI (or use --name / --sync from the CLI) when you run from a laptop or CI.
Run from the CLI
Use the steps in Getting started or Run tests. After the run starts, open it from Overview, Scenarios, or Runs to watch live metrics and the final summary.
Tip from Overview: the hub shows a ready-to-copy snippet with spanline test run --scenario-id <id>.
Watch and abort a run
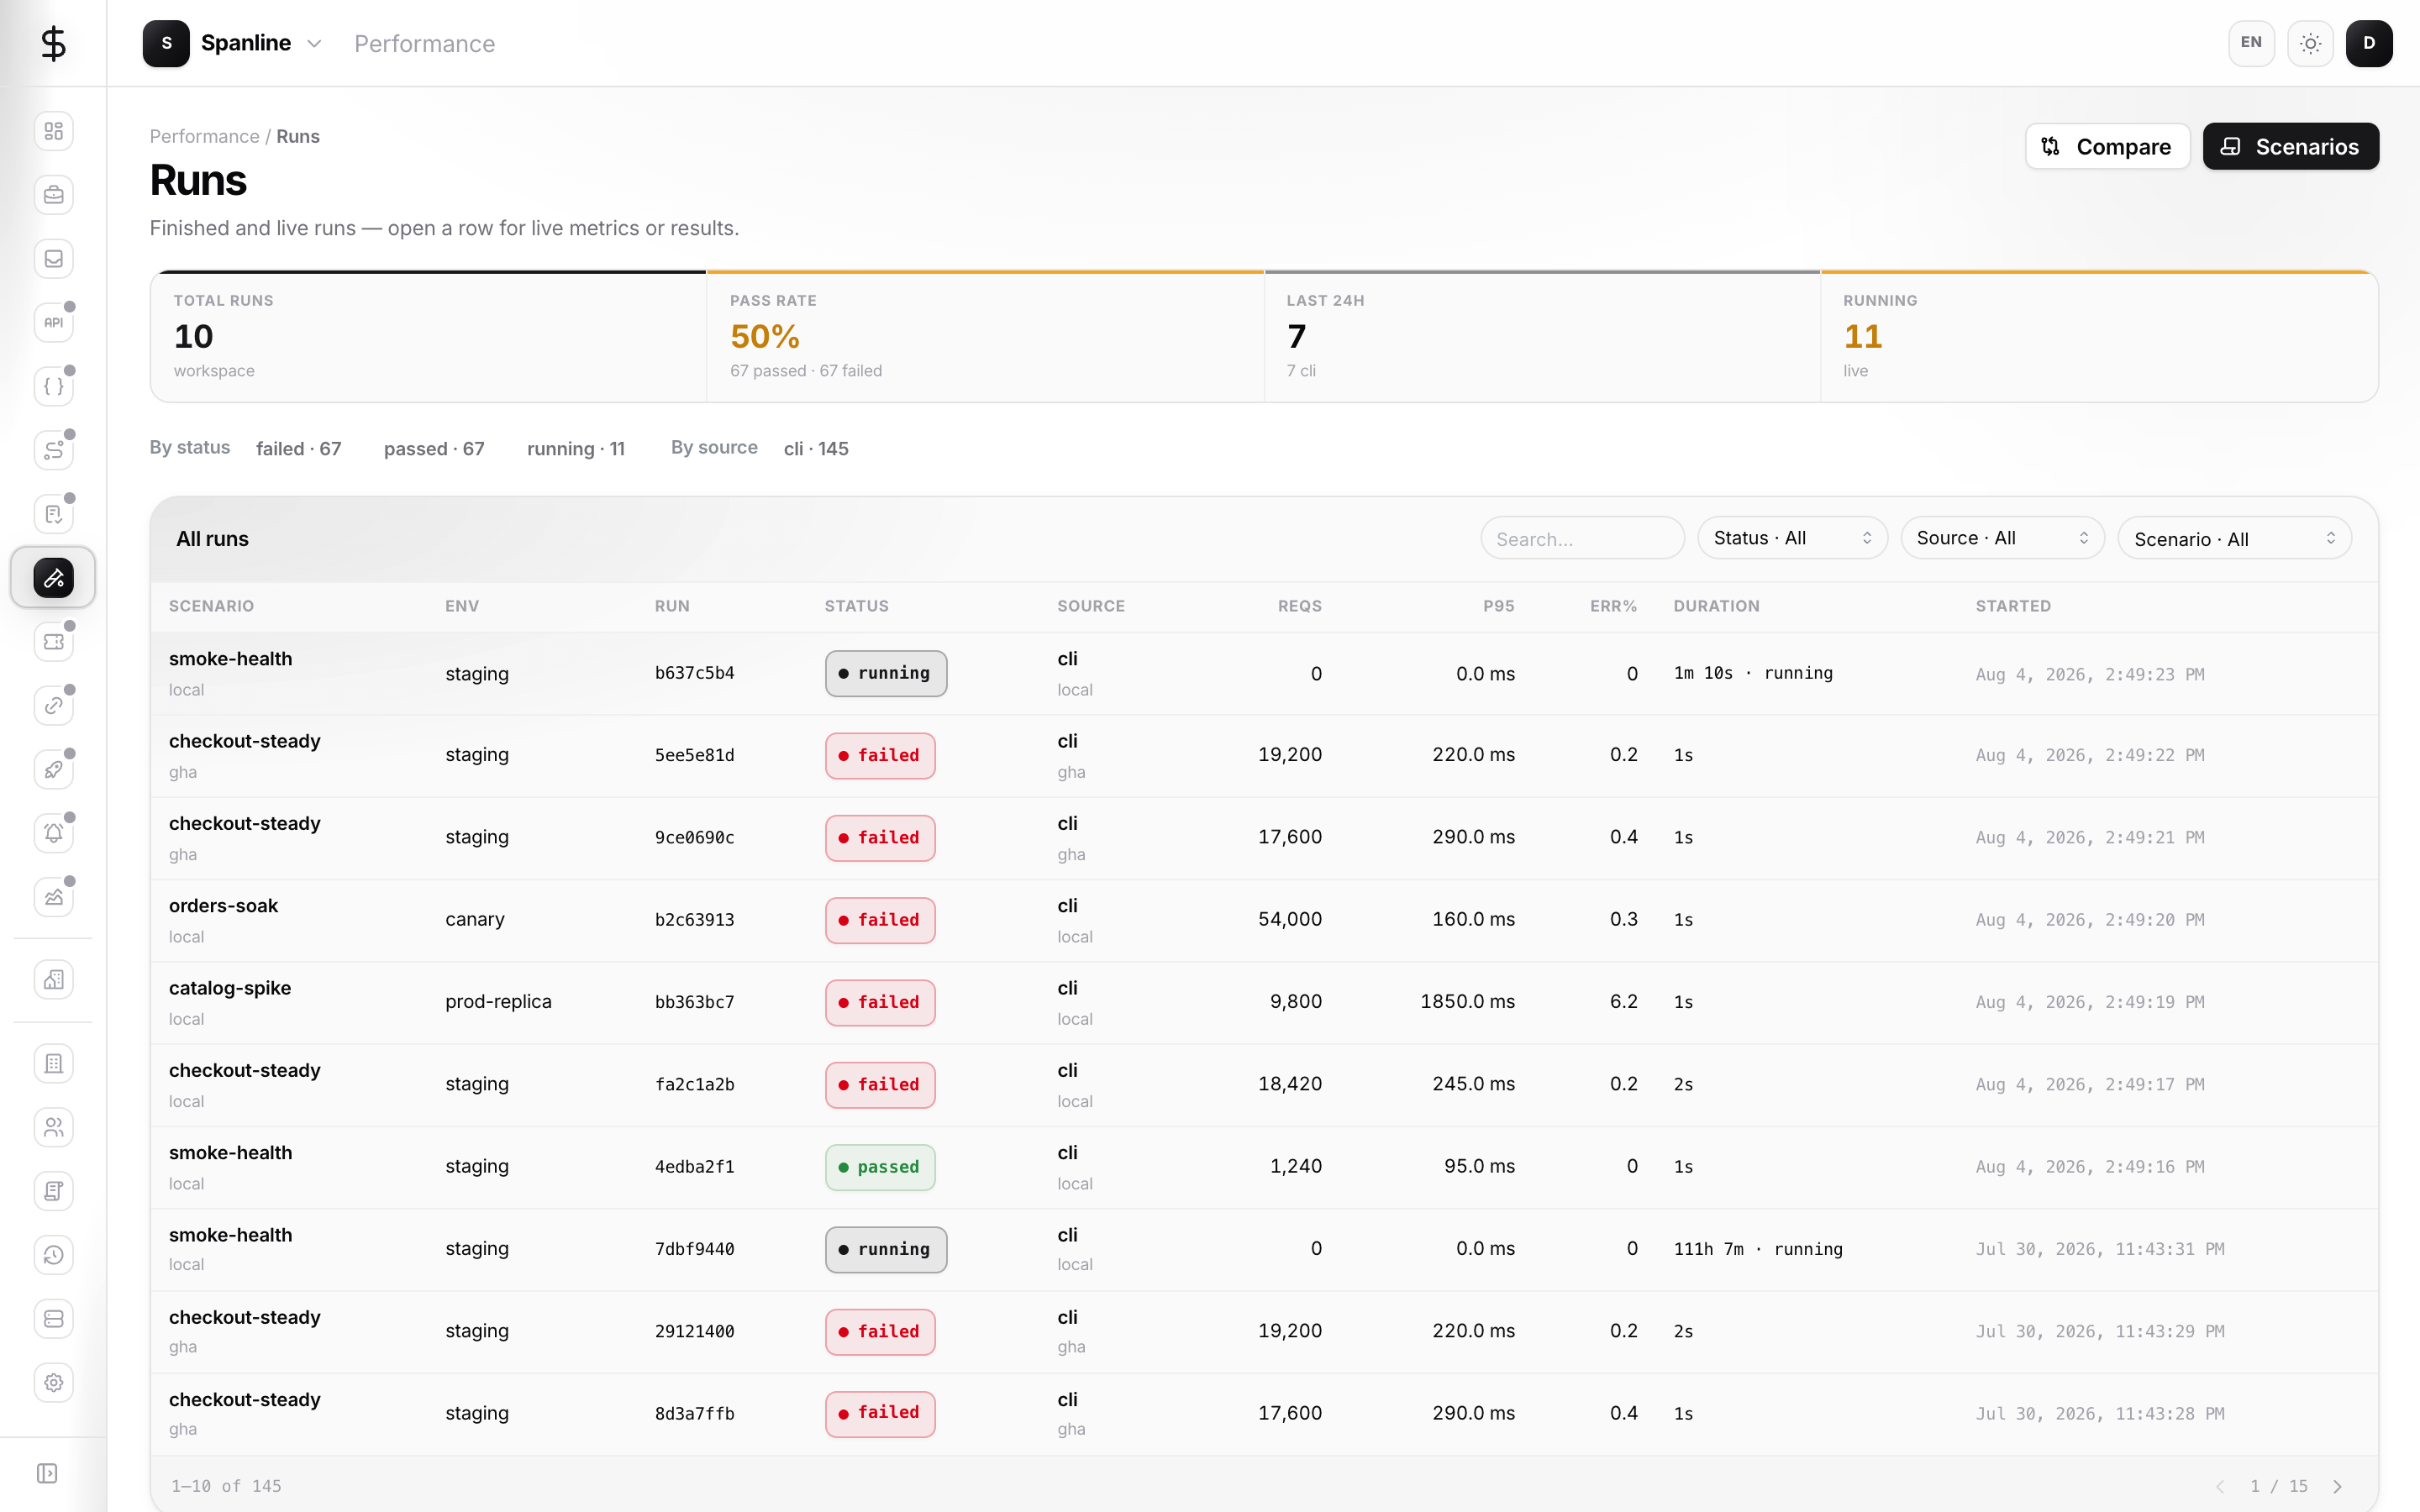
- Open Performance → Runs (or jump from Overview → recent runs).
- Use search and filters (status, source, scenario) when the list is long.
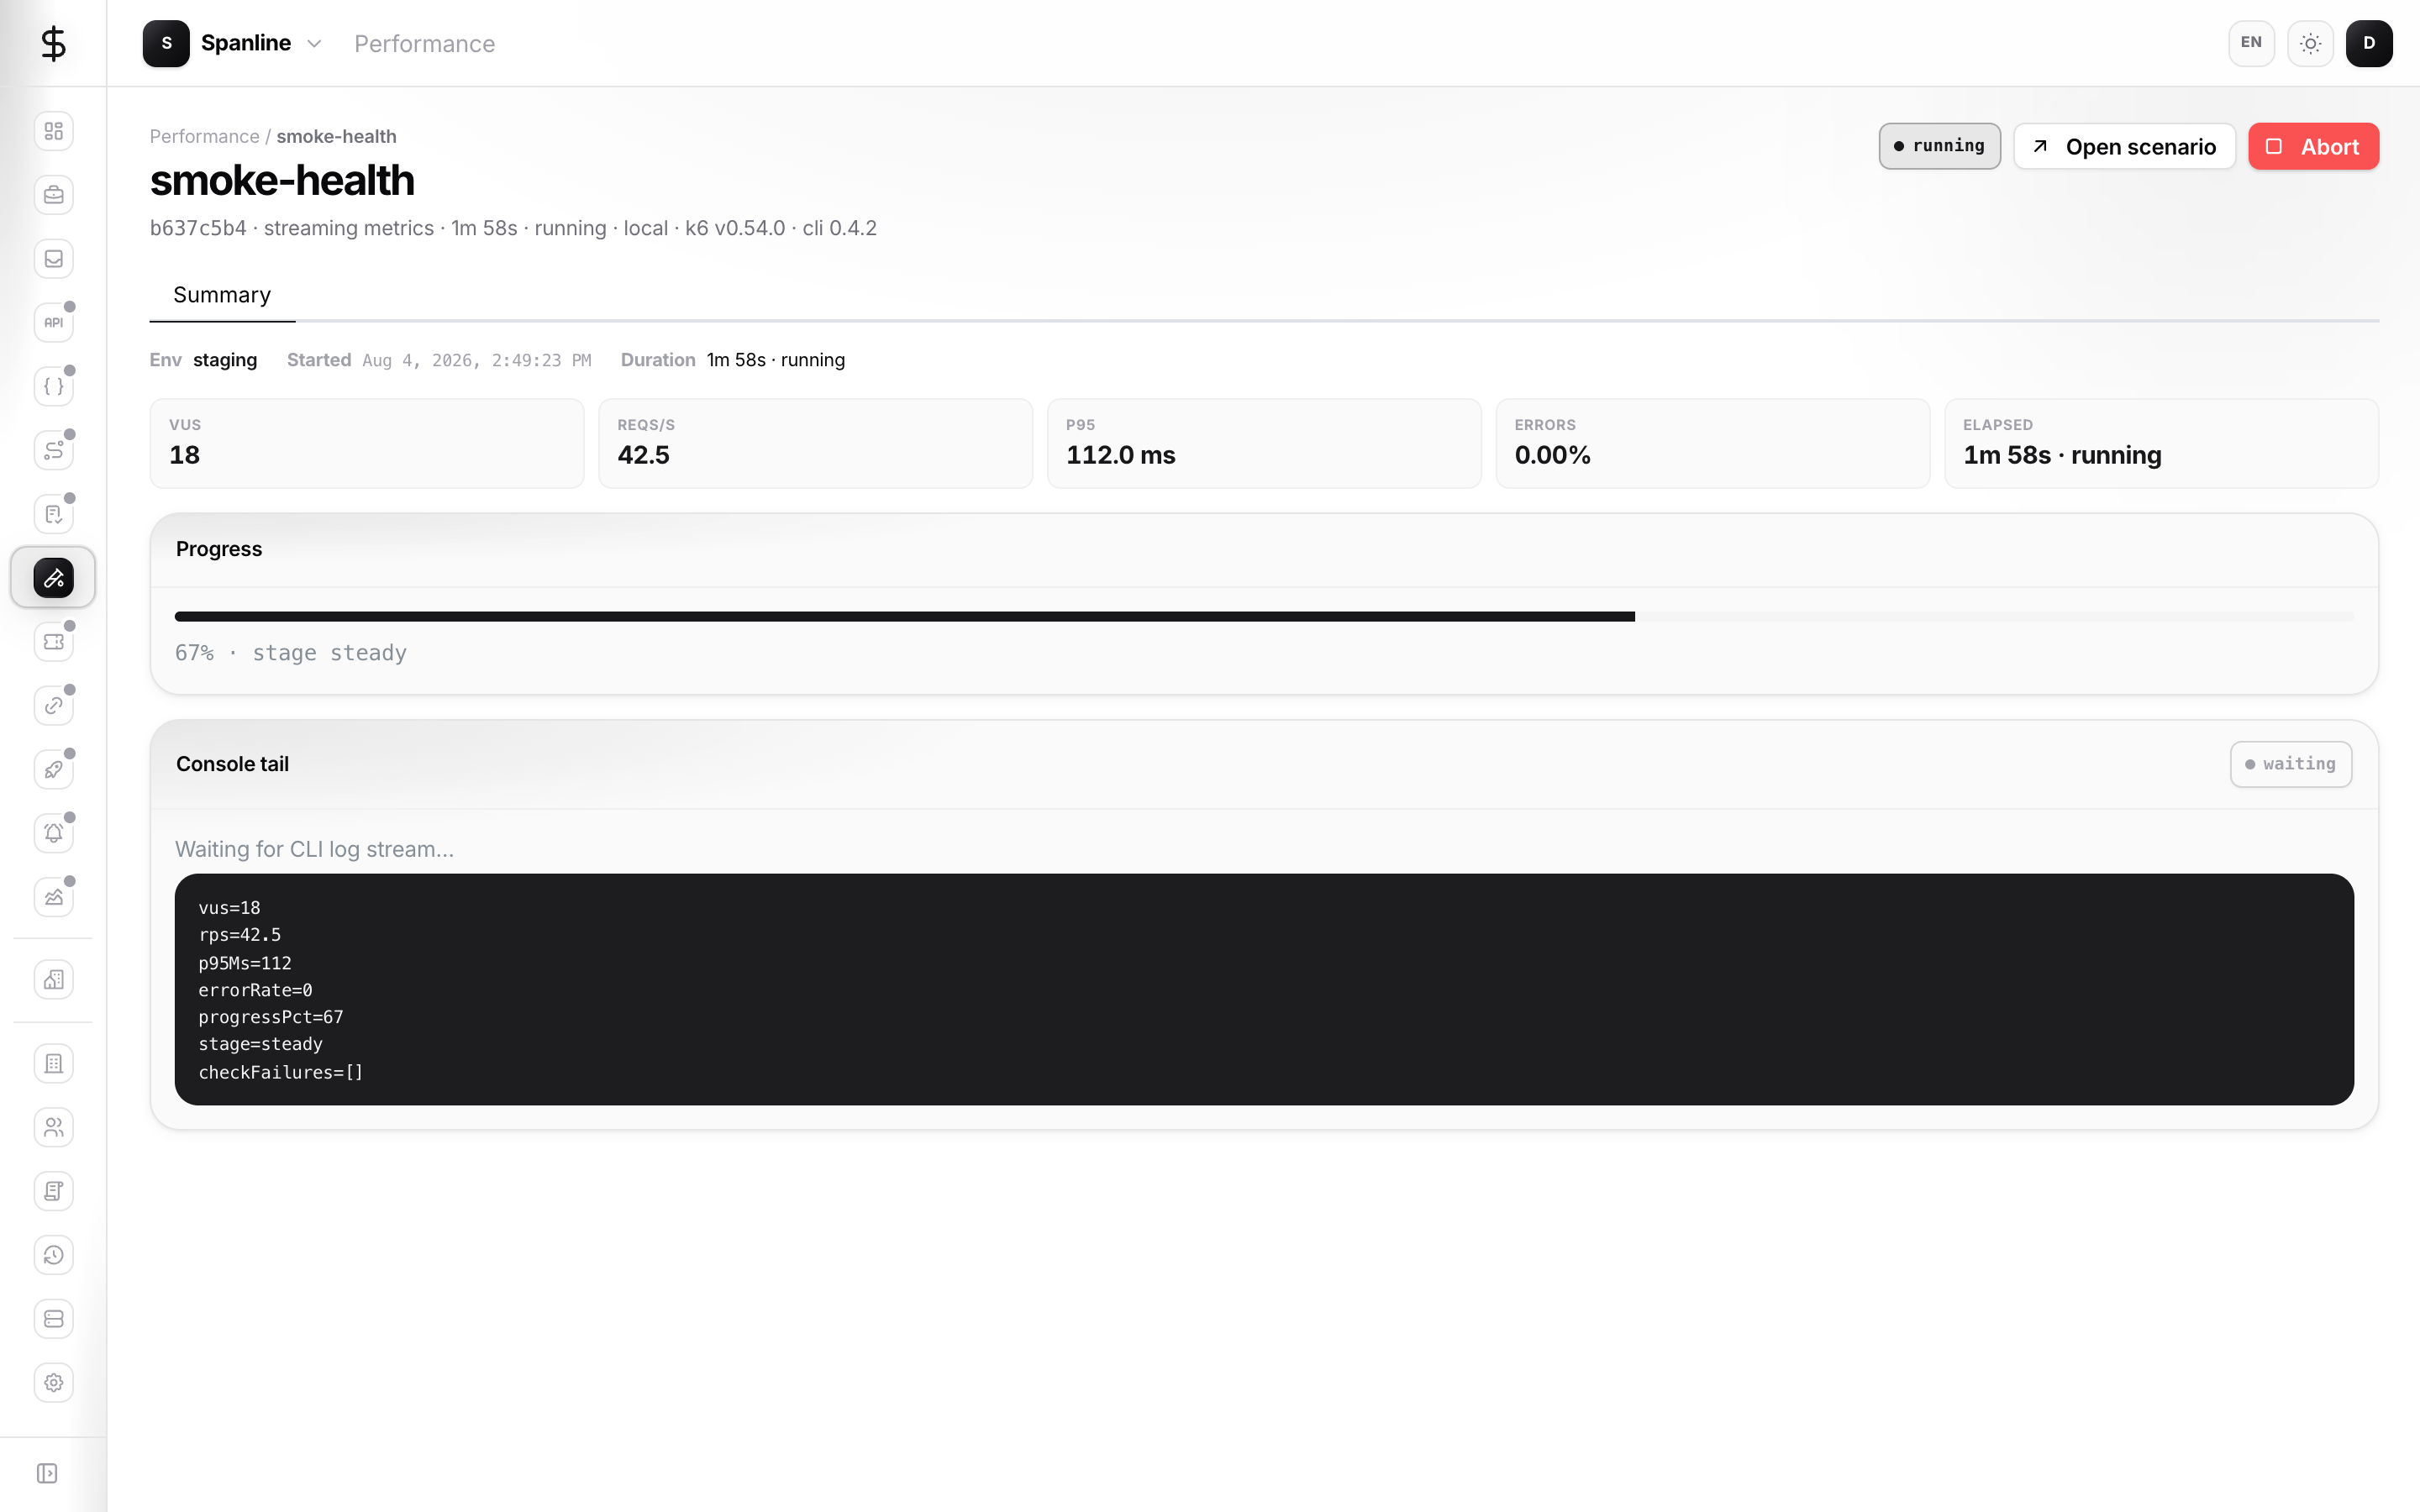
- Open a run to follow live samples (VUs, RPS, latency, errors) as they stream in.
- Use Abort if you need to stop early — the runner picks up the abort on its next check.
Run detail tabs (finished runs)
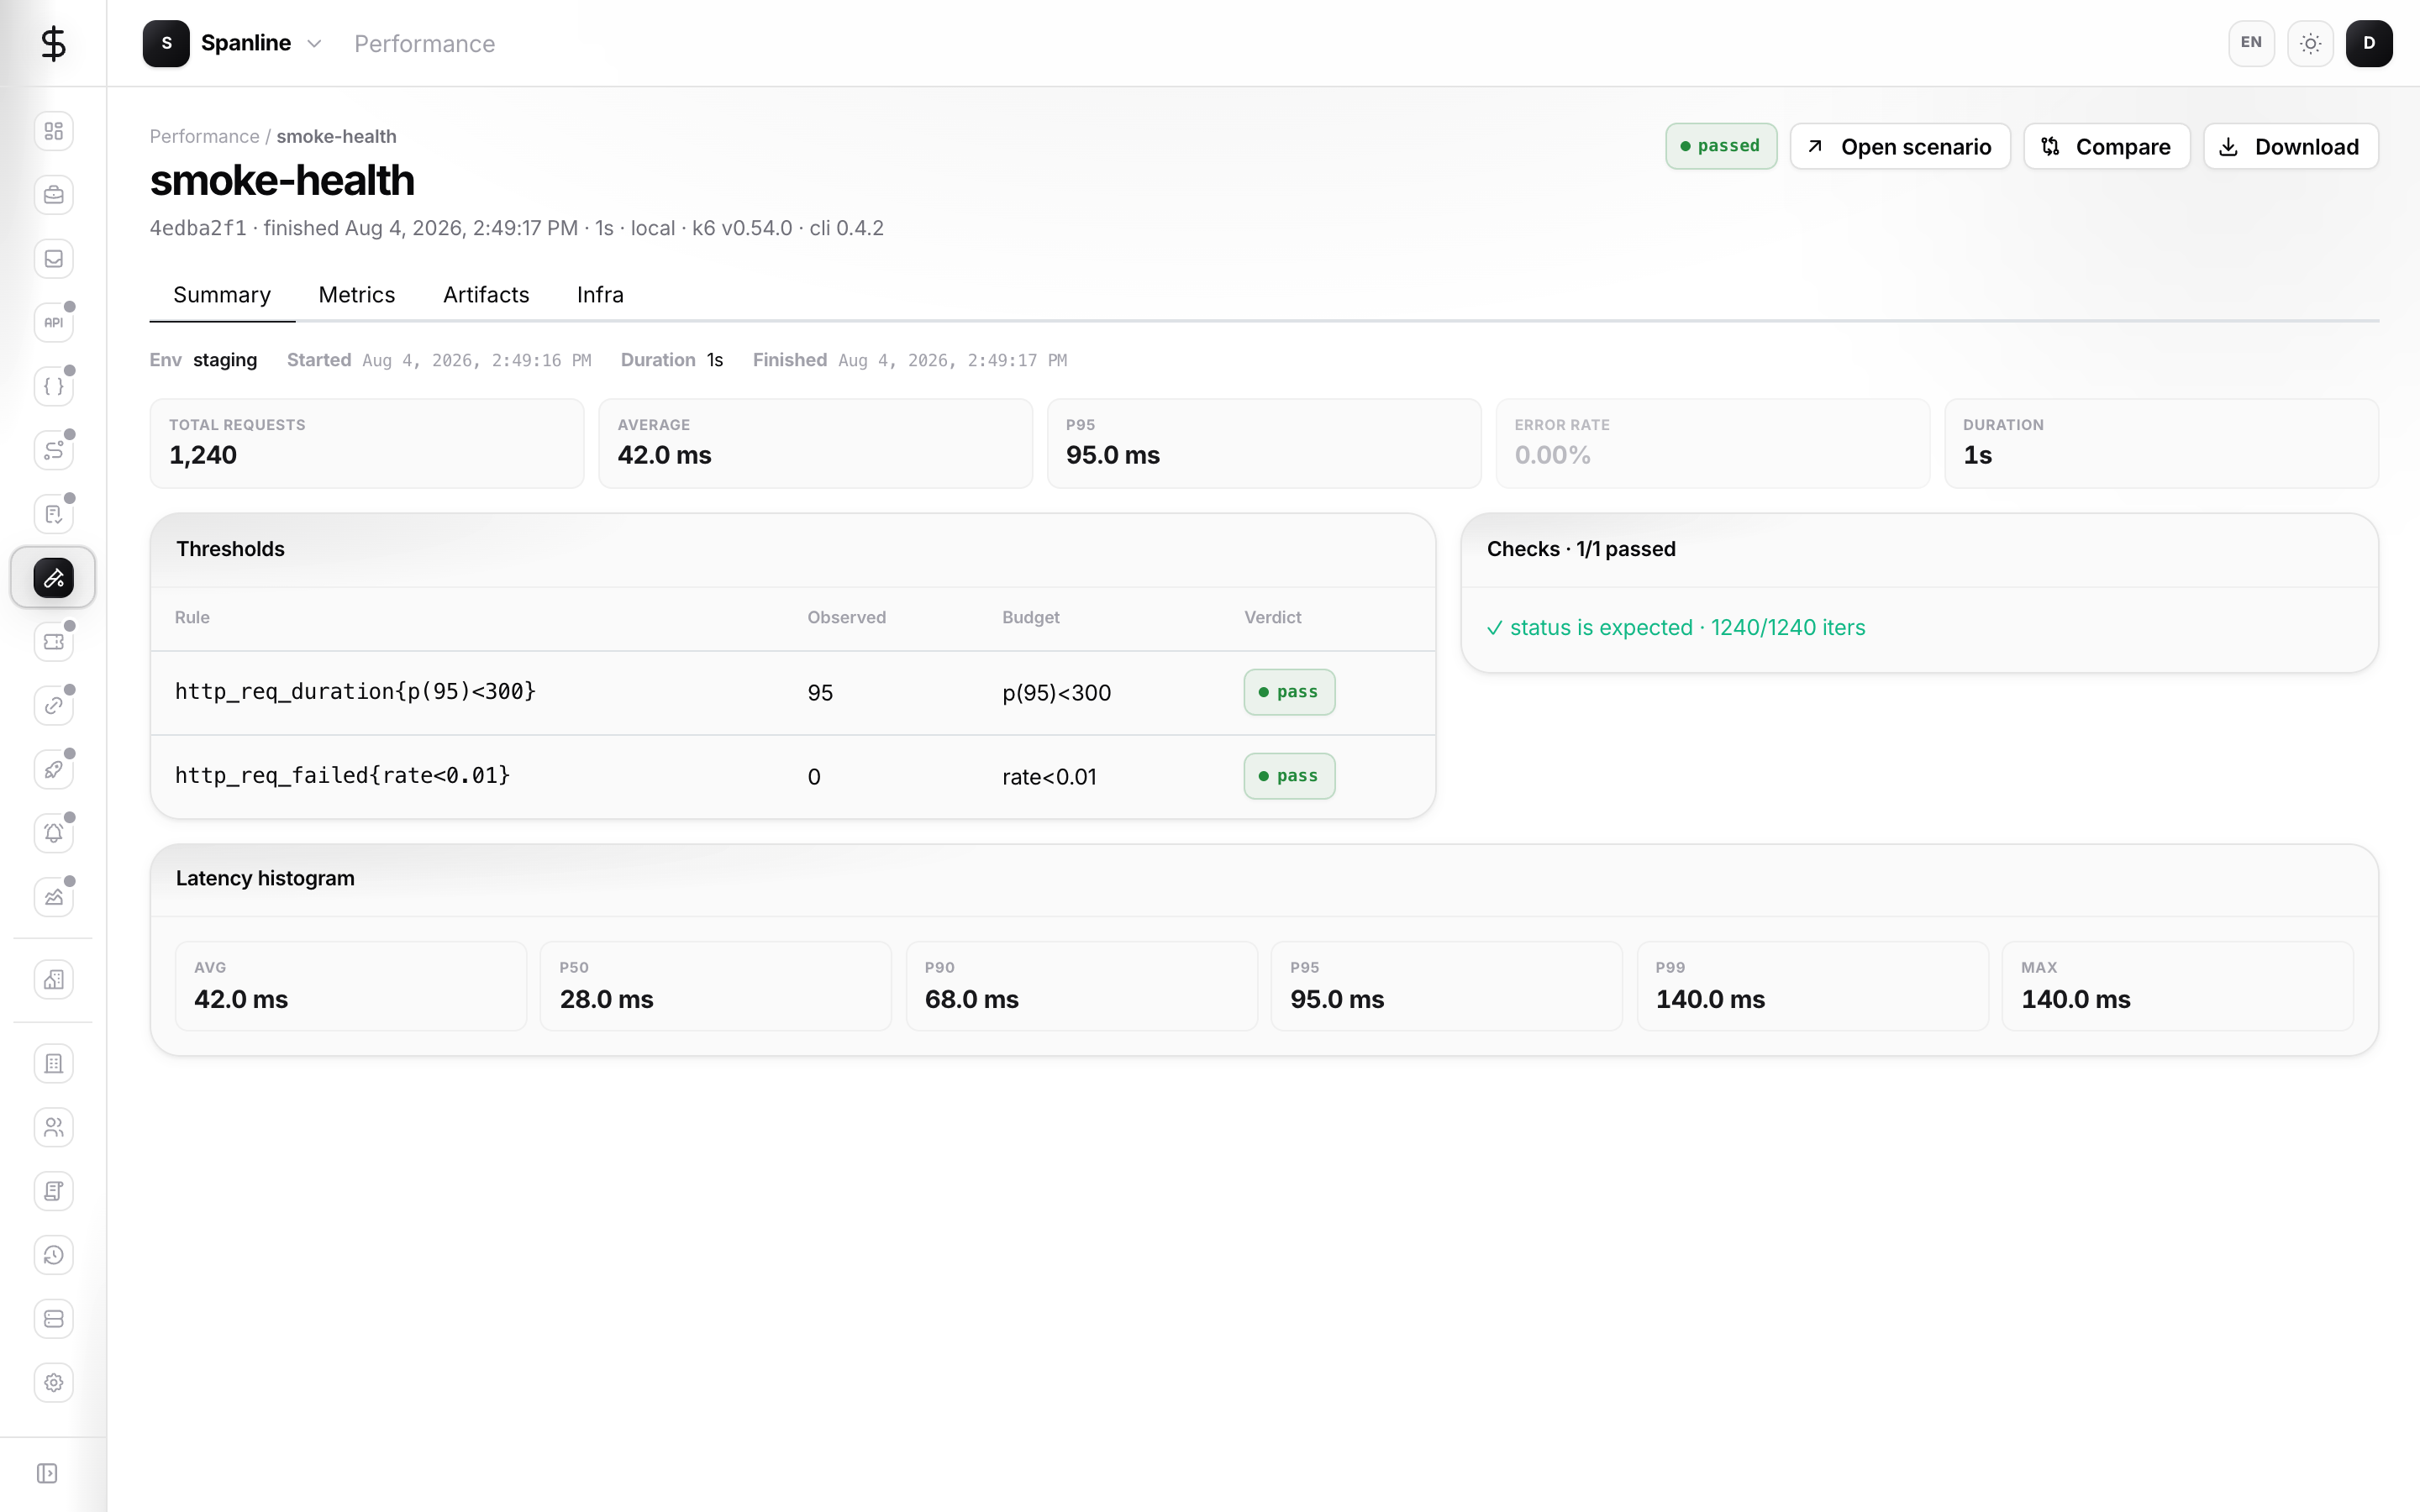
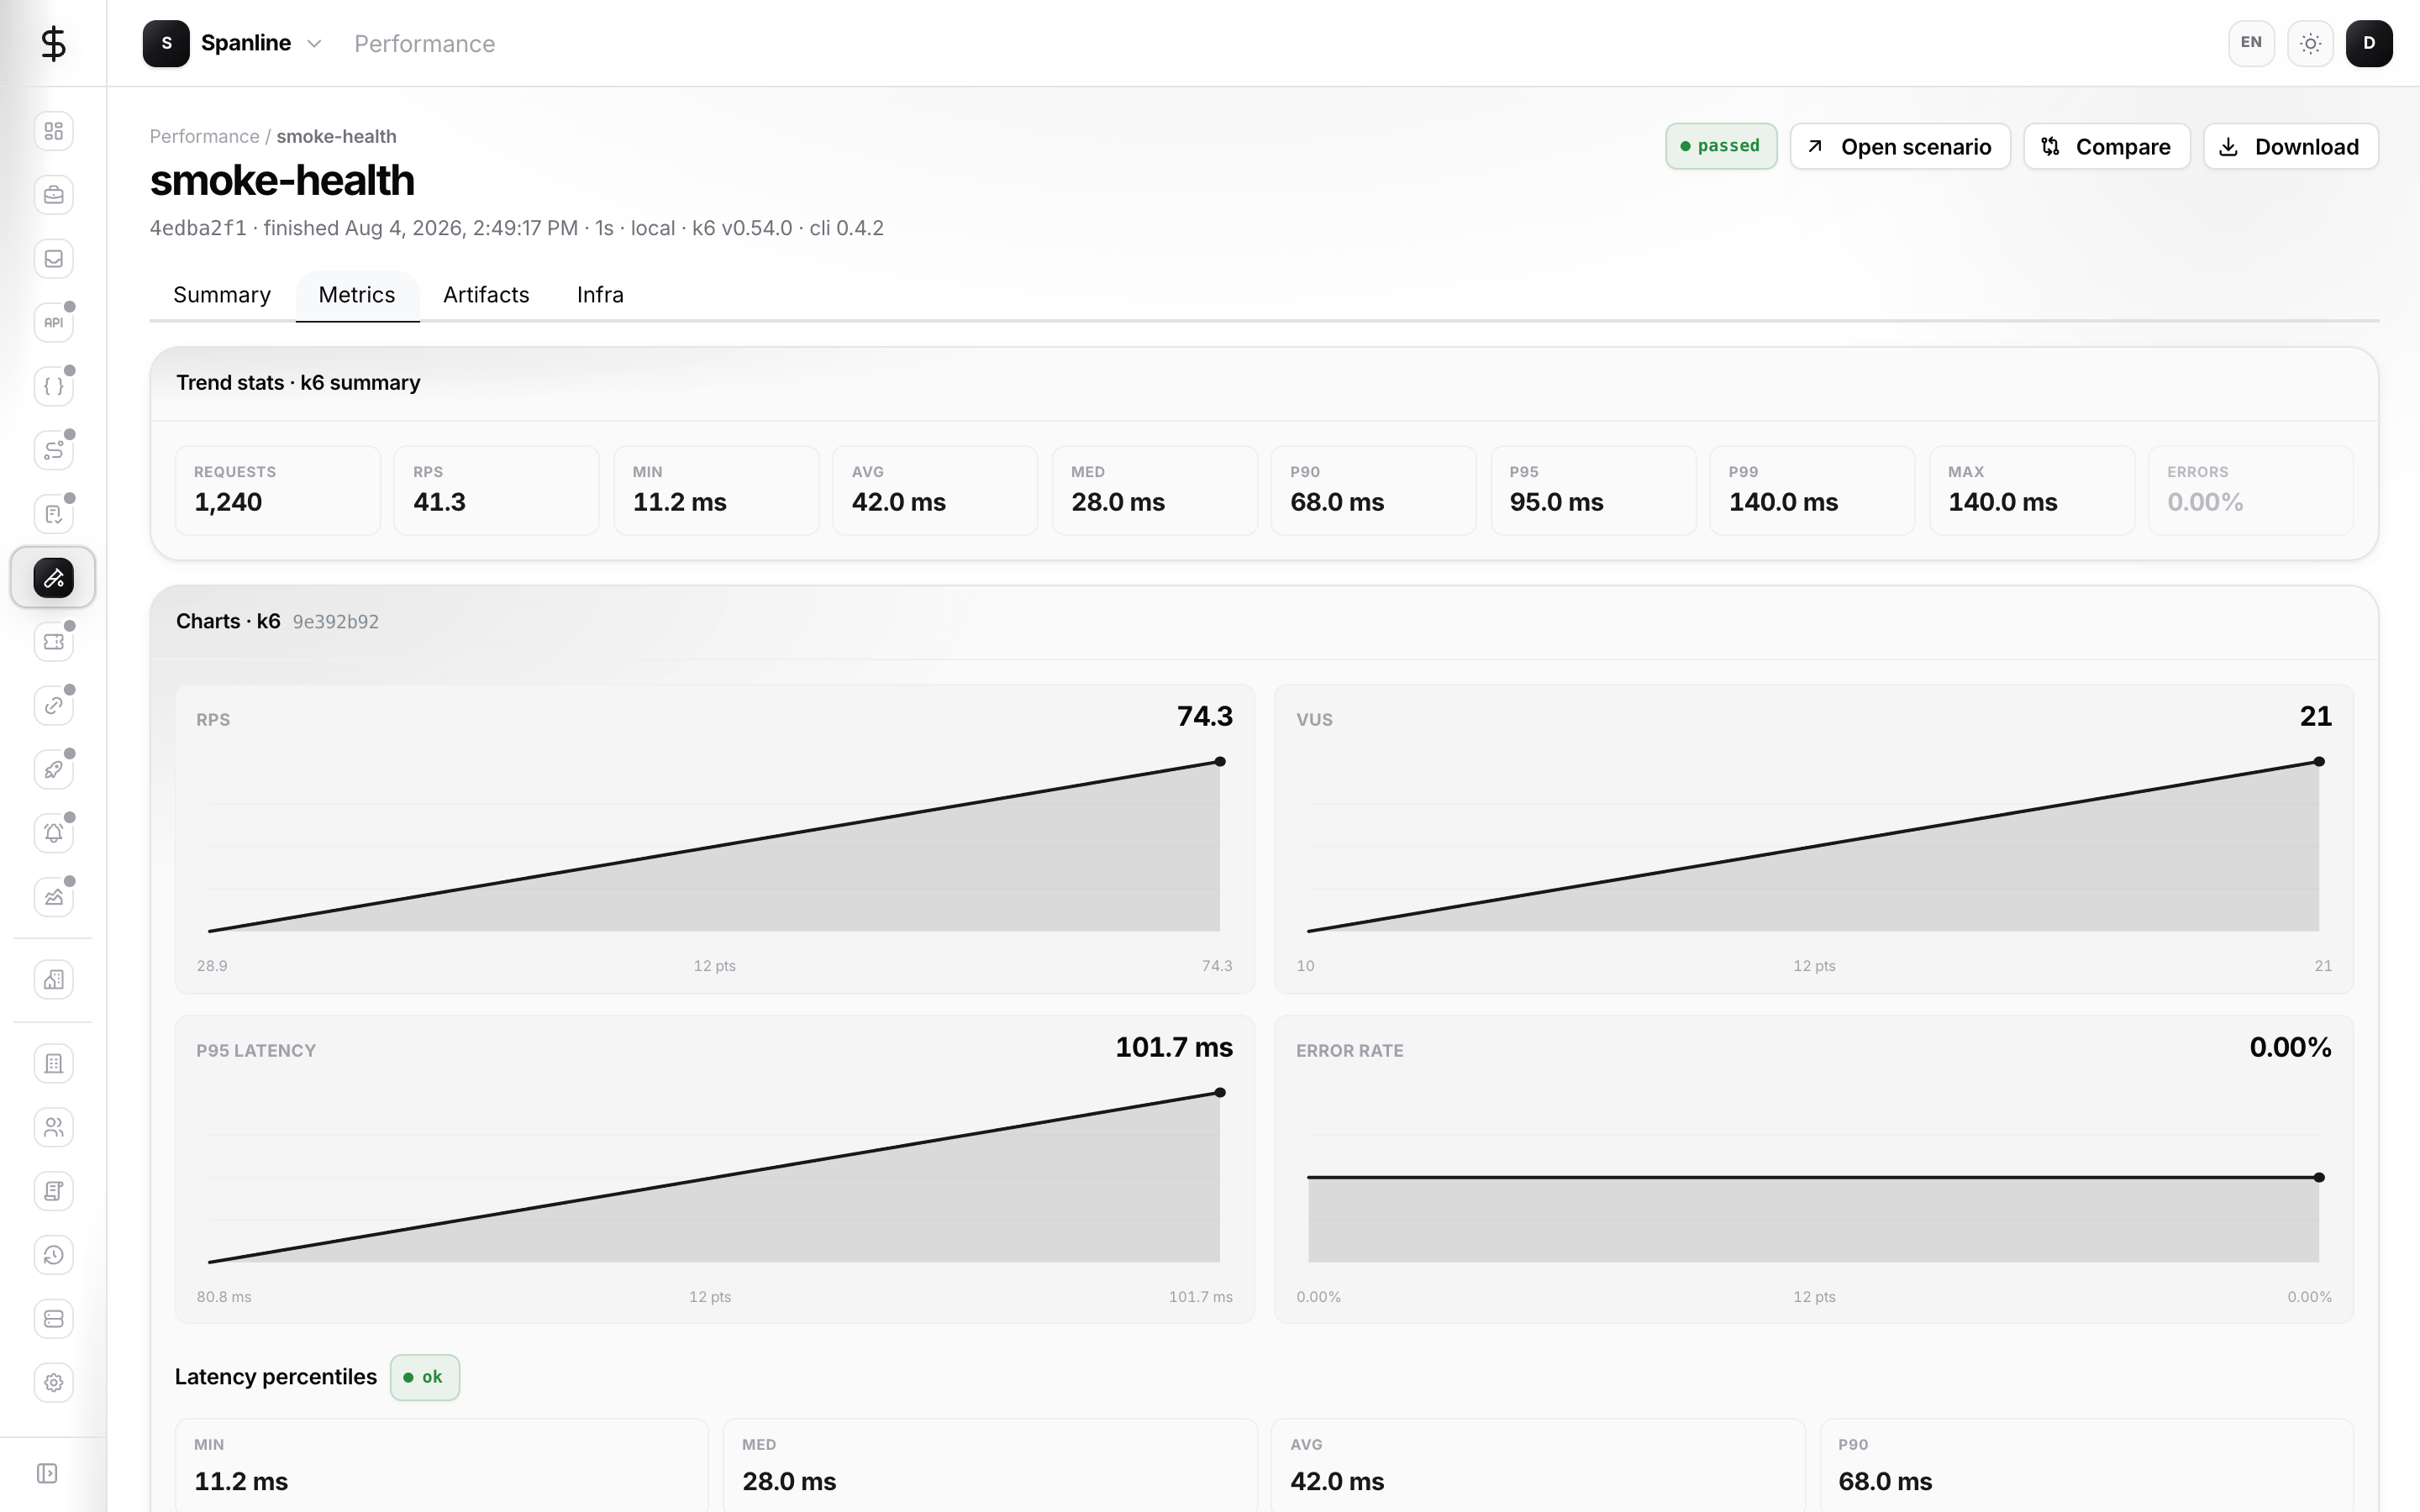
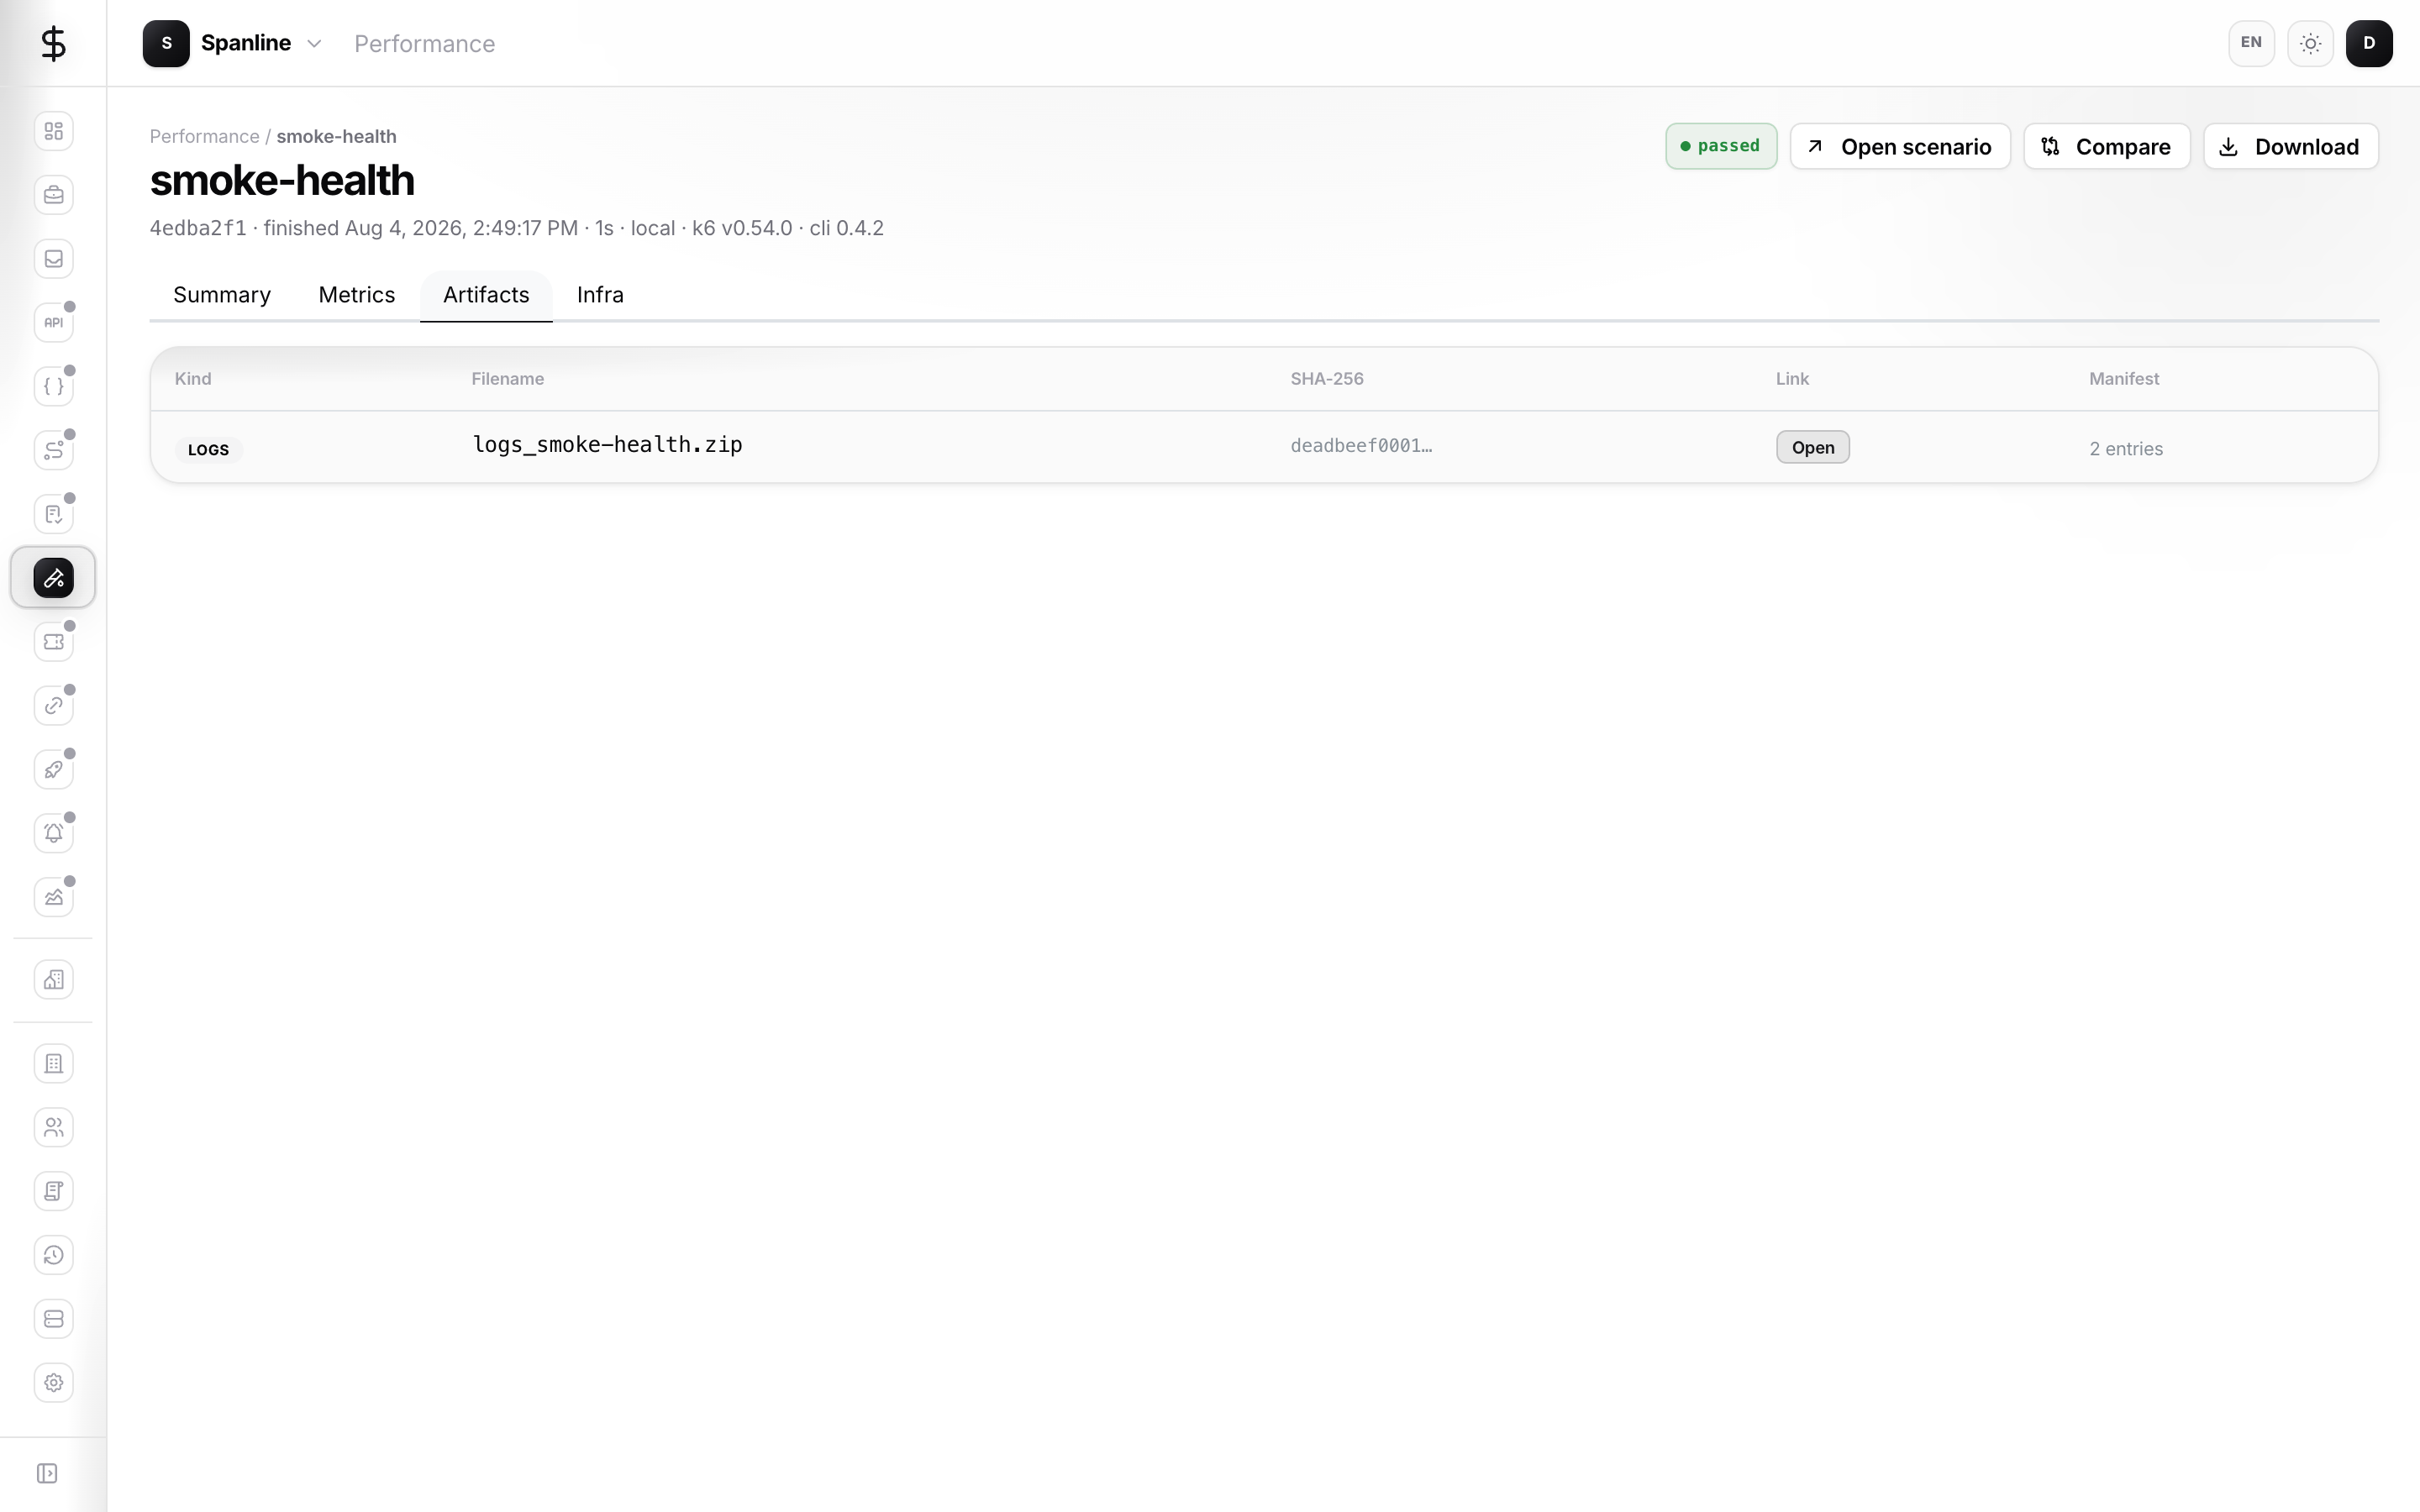
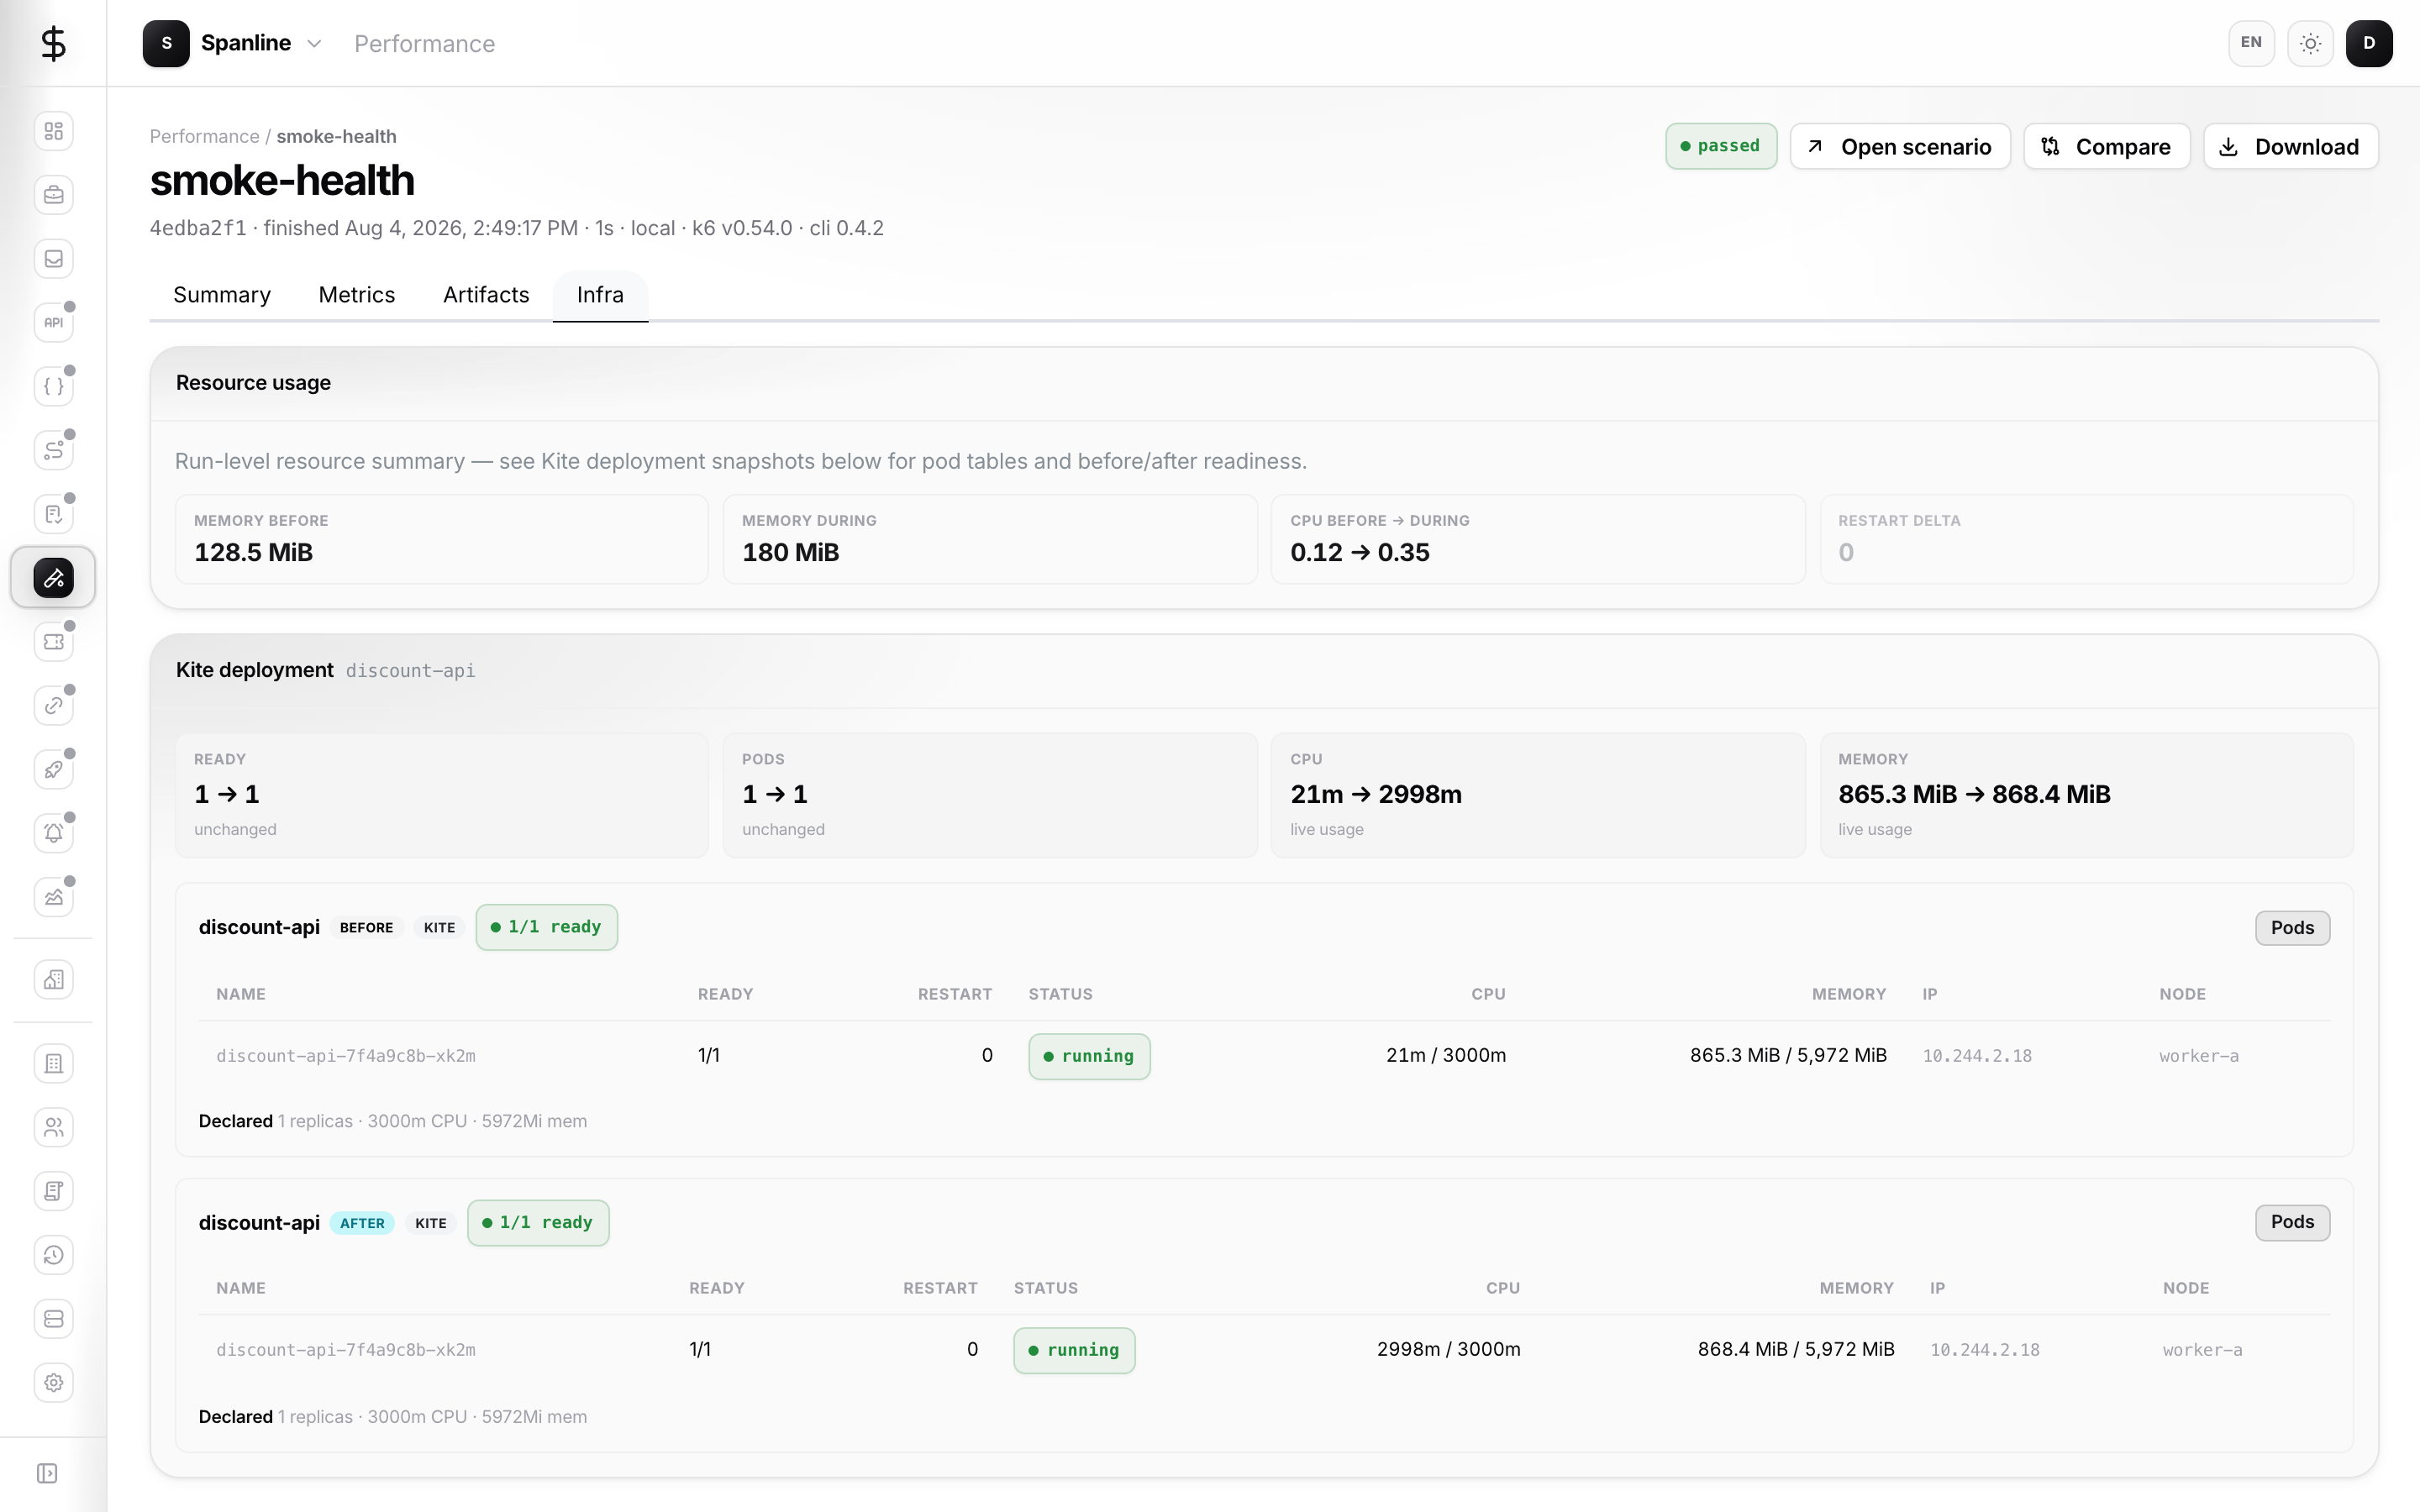
While a run is live you mainly use the Summary view. After it finishes, extra tabs appear:
| Tab / control | What you get |
|---|---|
| Summary | Metrics strip, progress, thresholds, checks, console tail |
| Metrics | Latency charts and related observation panels |
| Artifacts | Files uploaded with --upload-artifacts (download each file) |
| Infra | Infrastructure snapshots (for example Kite) when collectors recorded them |
| Download (header) | Downloads the summary JSON — separate from the Artifacts tab |
| Compare | Opens Compare with this run as a starting point |
Compare two runs
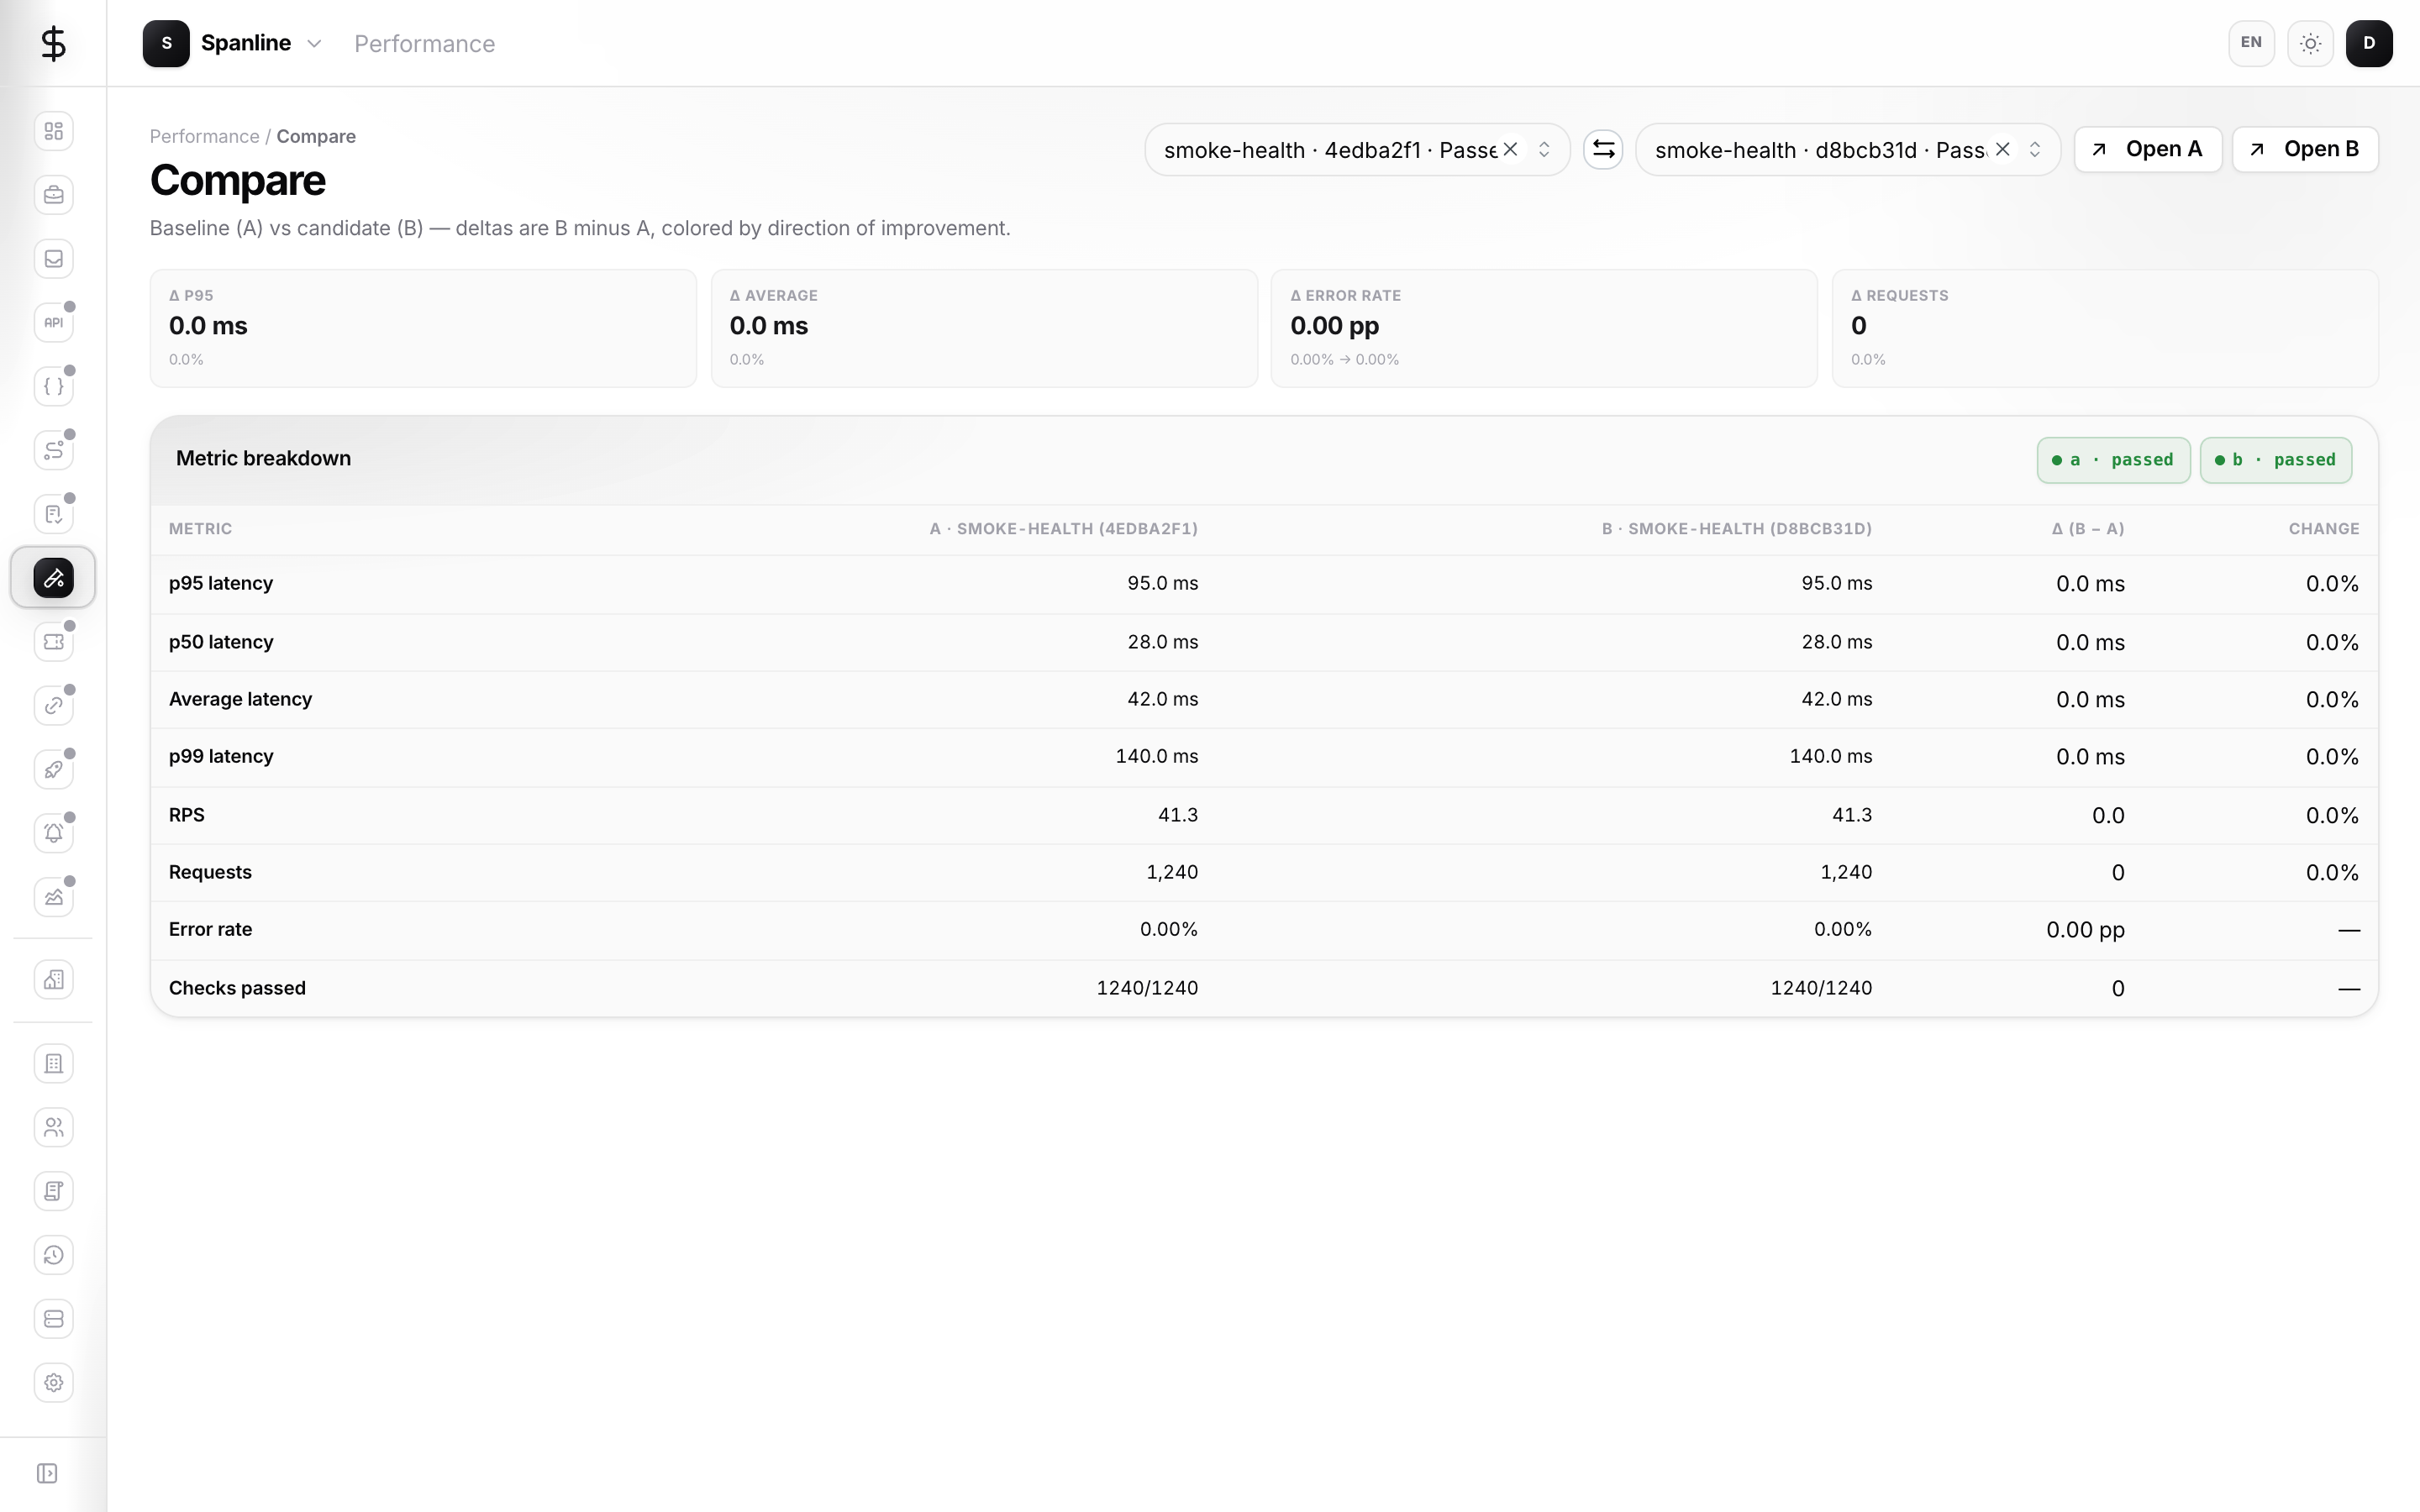
- Open Performance → Compare.
- Pick Baseline (A) and Candidate (B) in the same workspace (deep links also accept
?a=/?b=). - Review throughput, latency, and check deltas (shown as B − A).
Other entry points:
- Finished run detail → Compare
- Matrix evidence grid → as A on a row
Matrix, Reports, and Trends
All three use an evidence-style table, but they are not interchangeable. Full comparison: Concepts → which view?.
| You need… | Open |
|---|---|
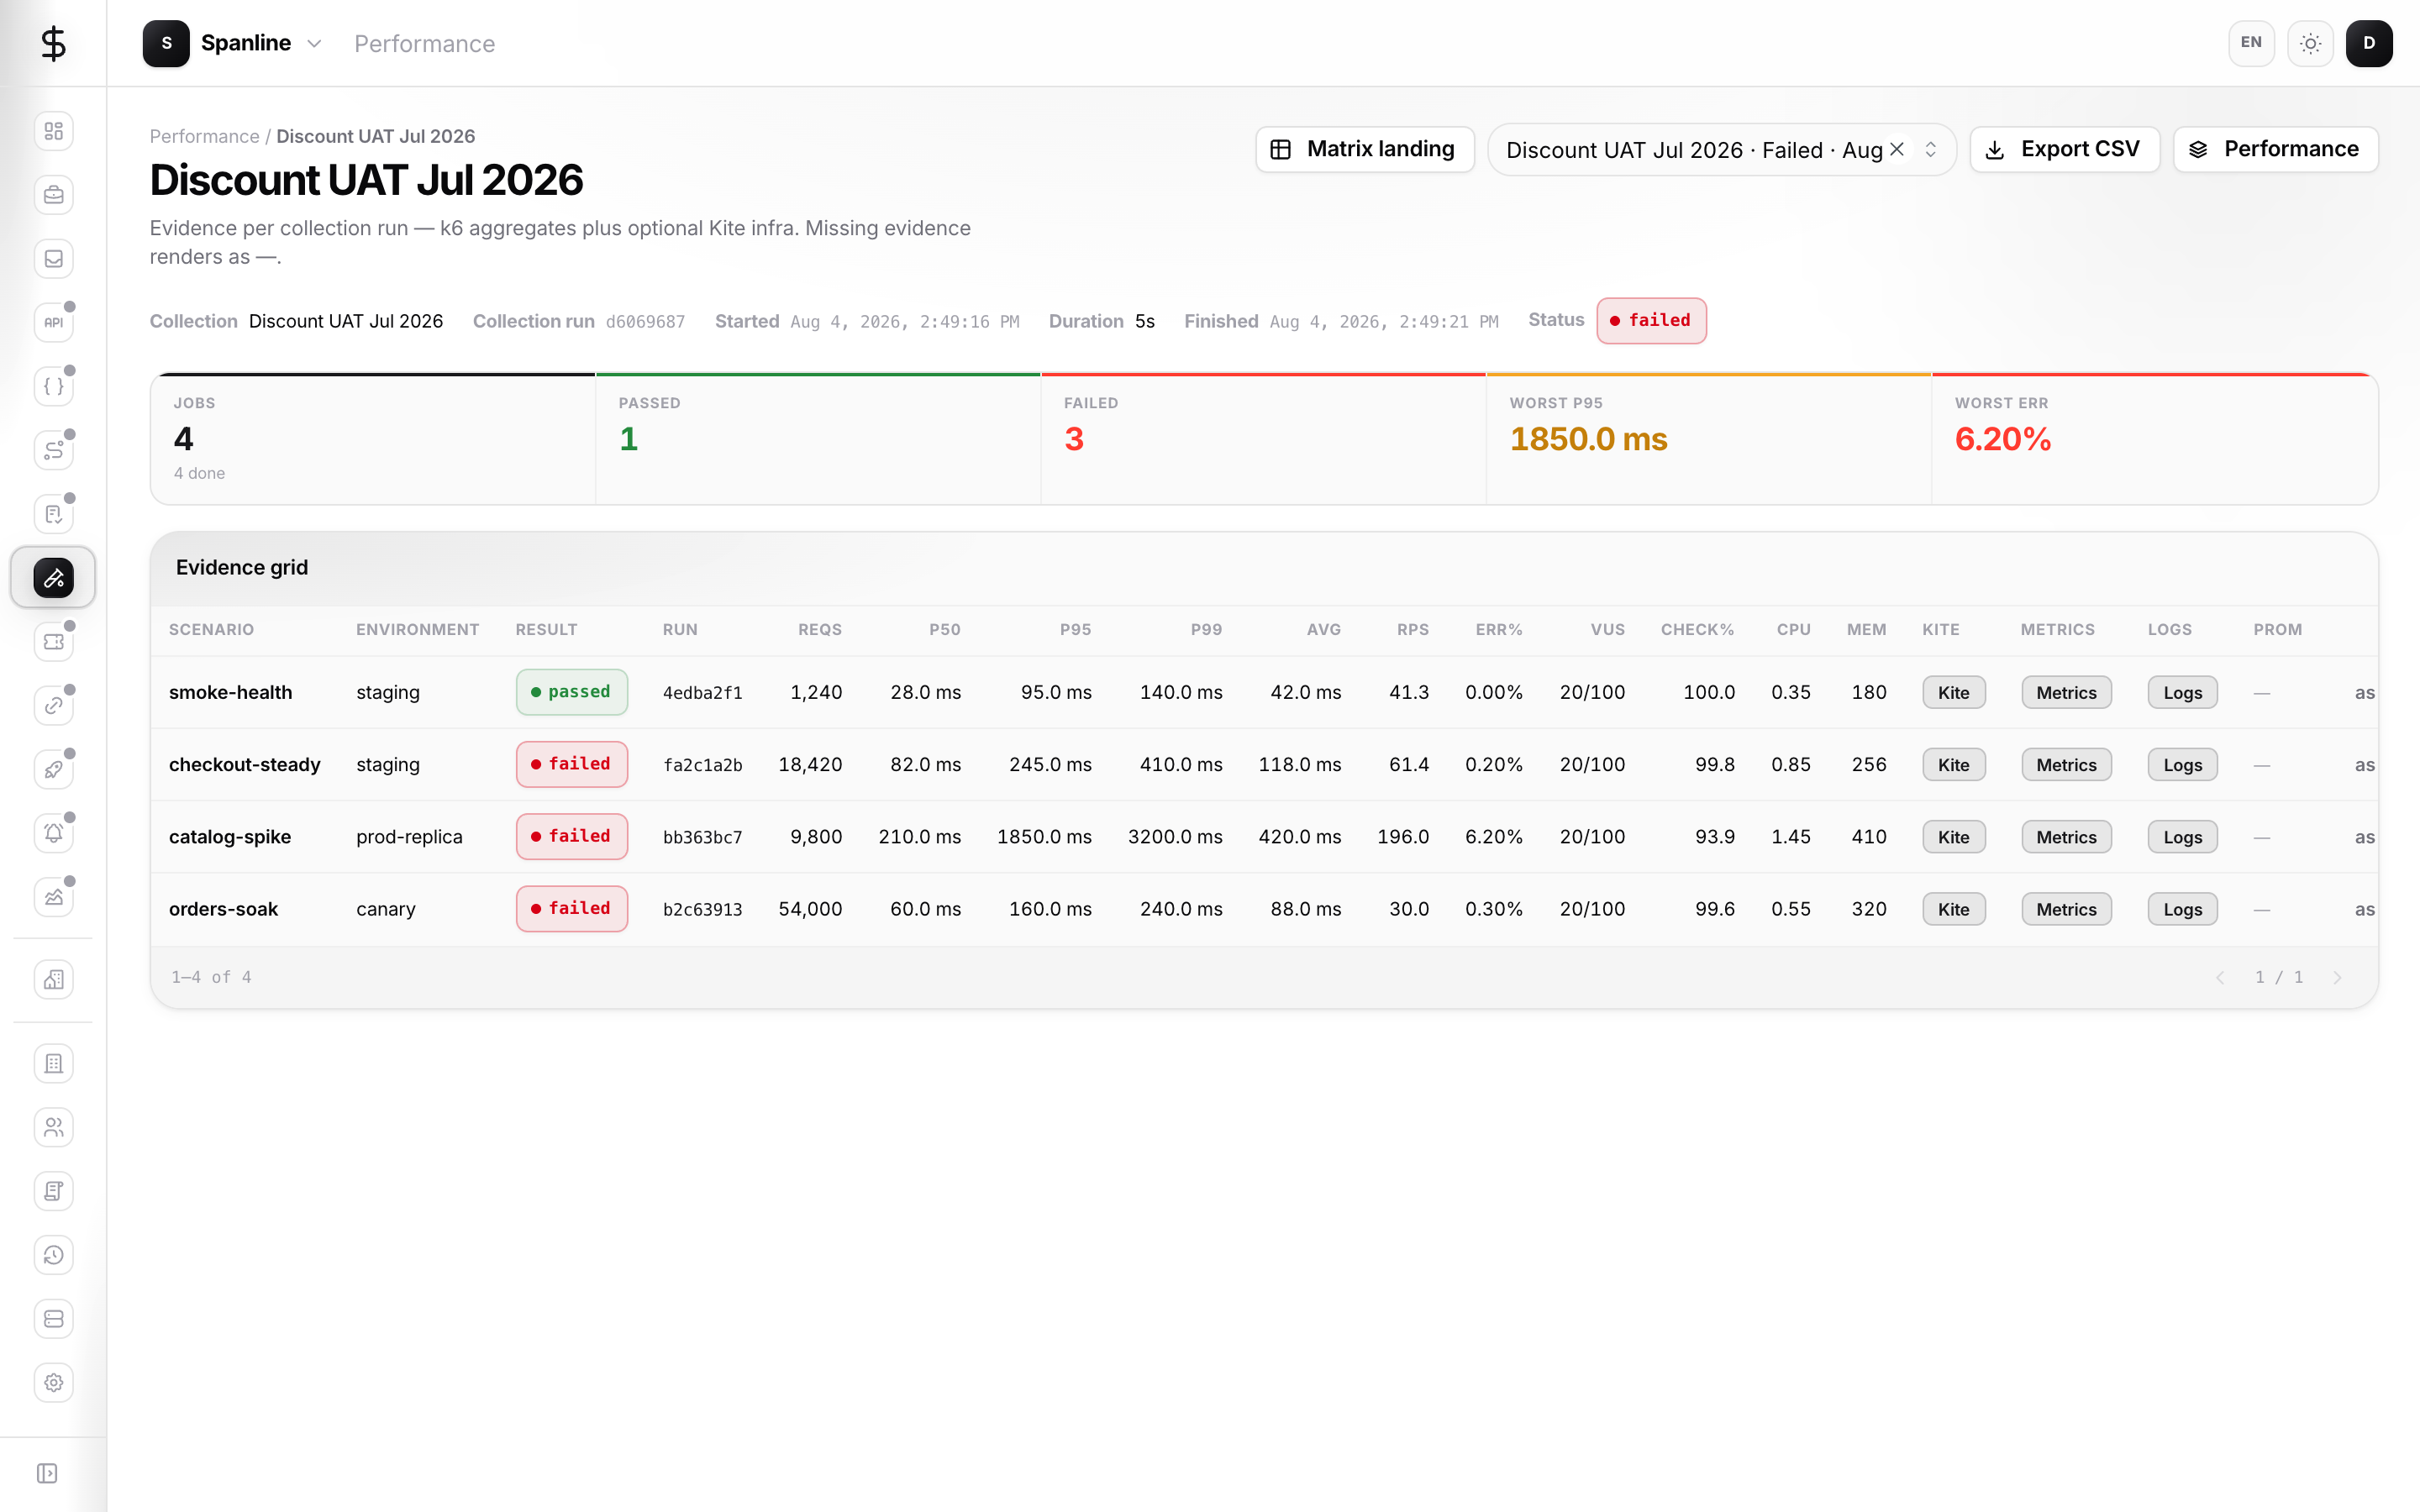
Sign-off for one collection-run batch |
Matrix |
| Every scenario in a collection across separate run times / dates | Reports → Collection window |
| Daily health rollups (pass rate, p95 drift) | Trends |
If you are unsure between Matrix and Reports: Matrix needs a collection run id from Start run + test collection-run. Reports needs only a collection and from/to dates — use it when jobs did not share one batch plan.
Collections and matrix
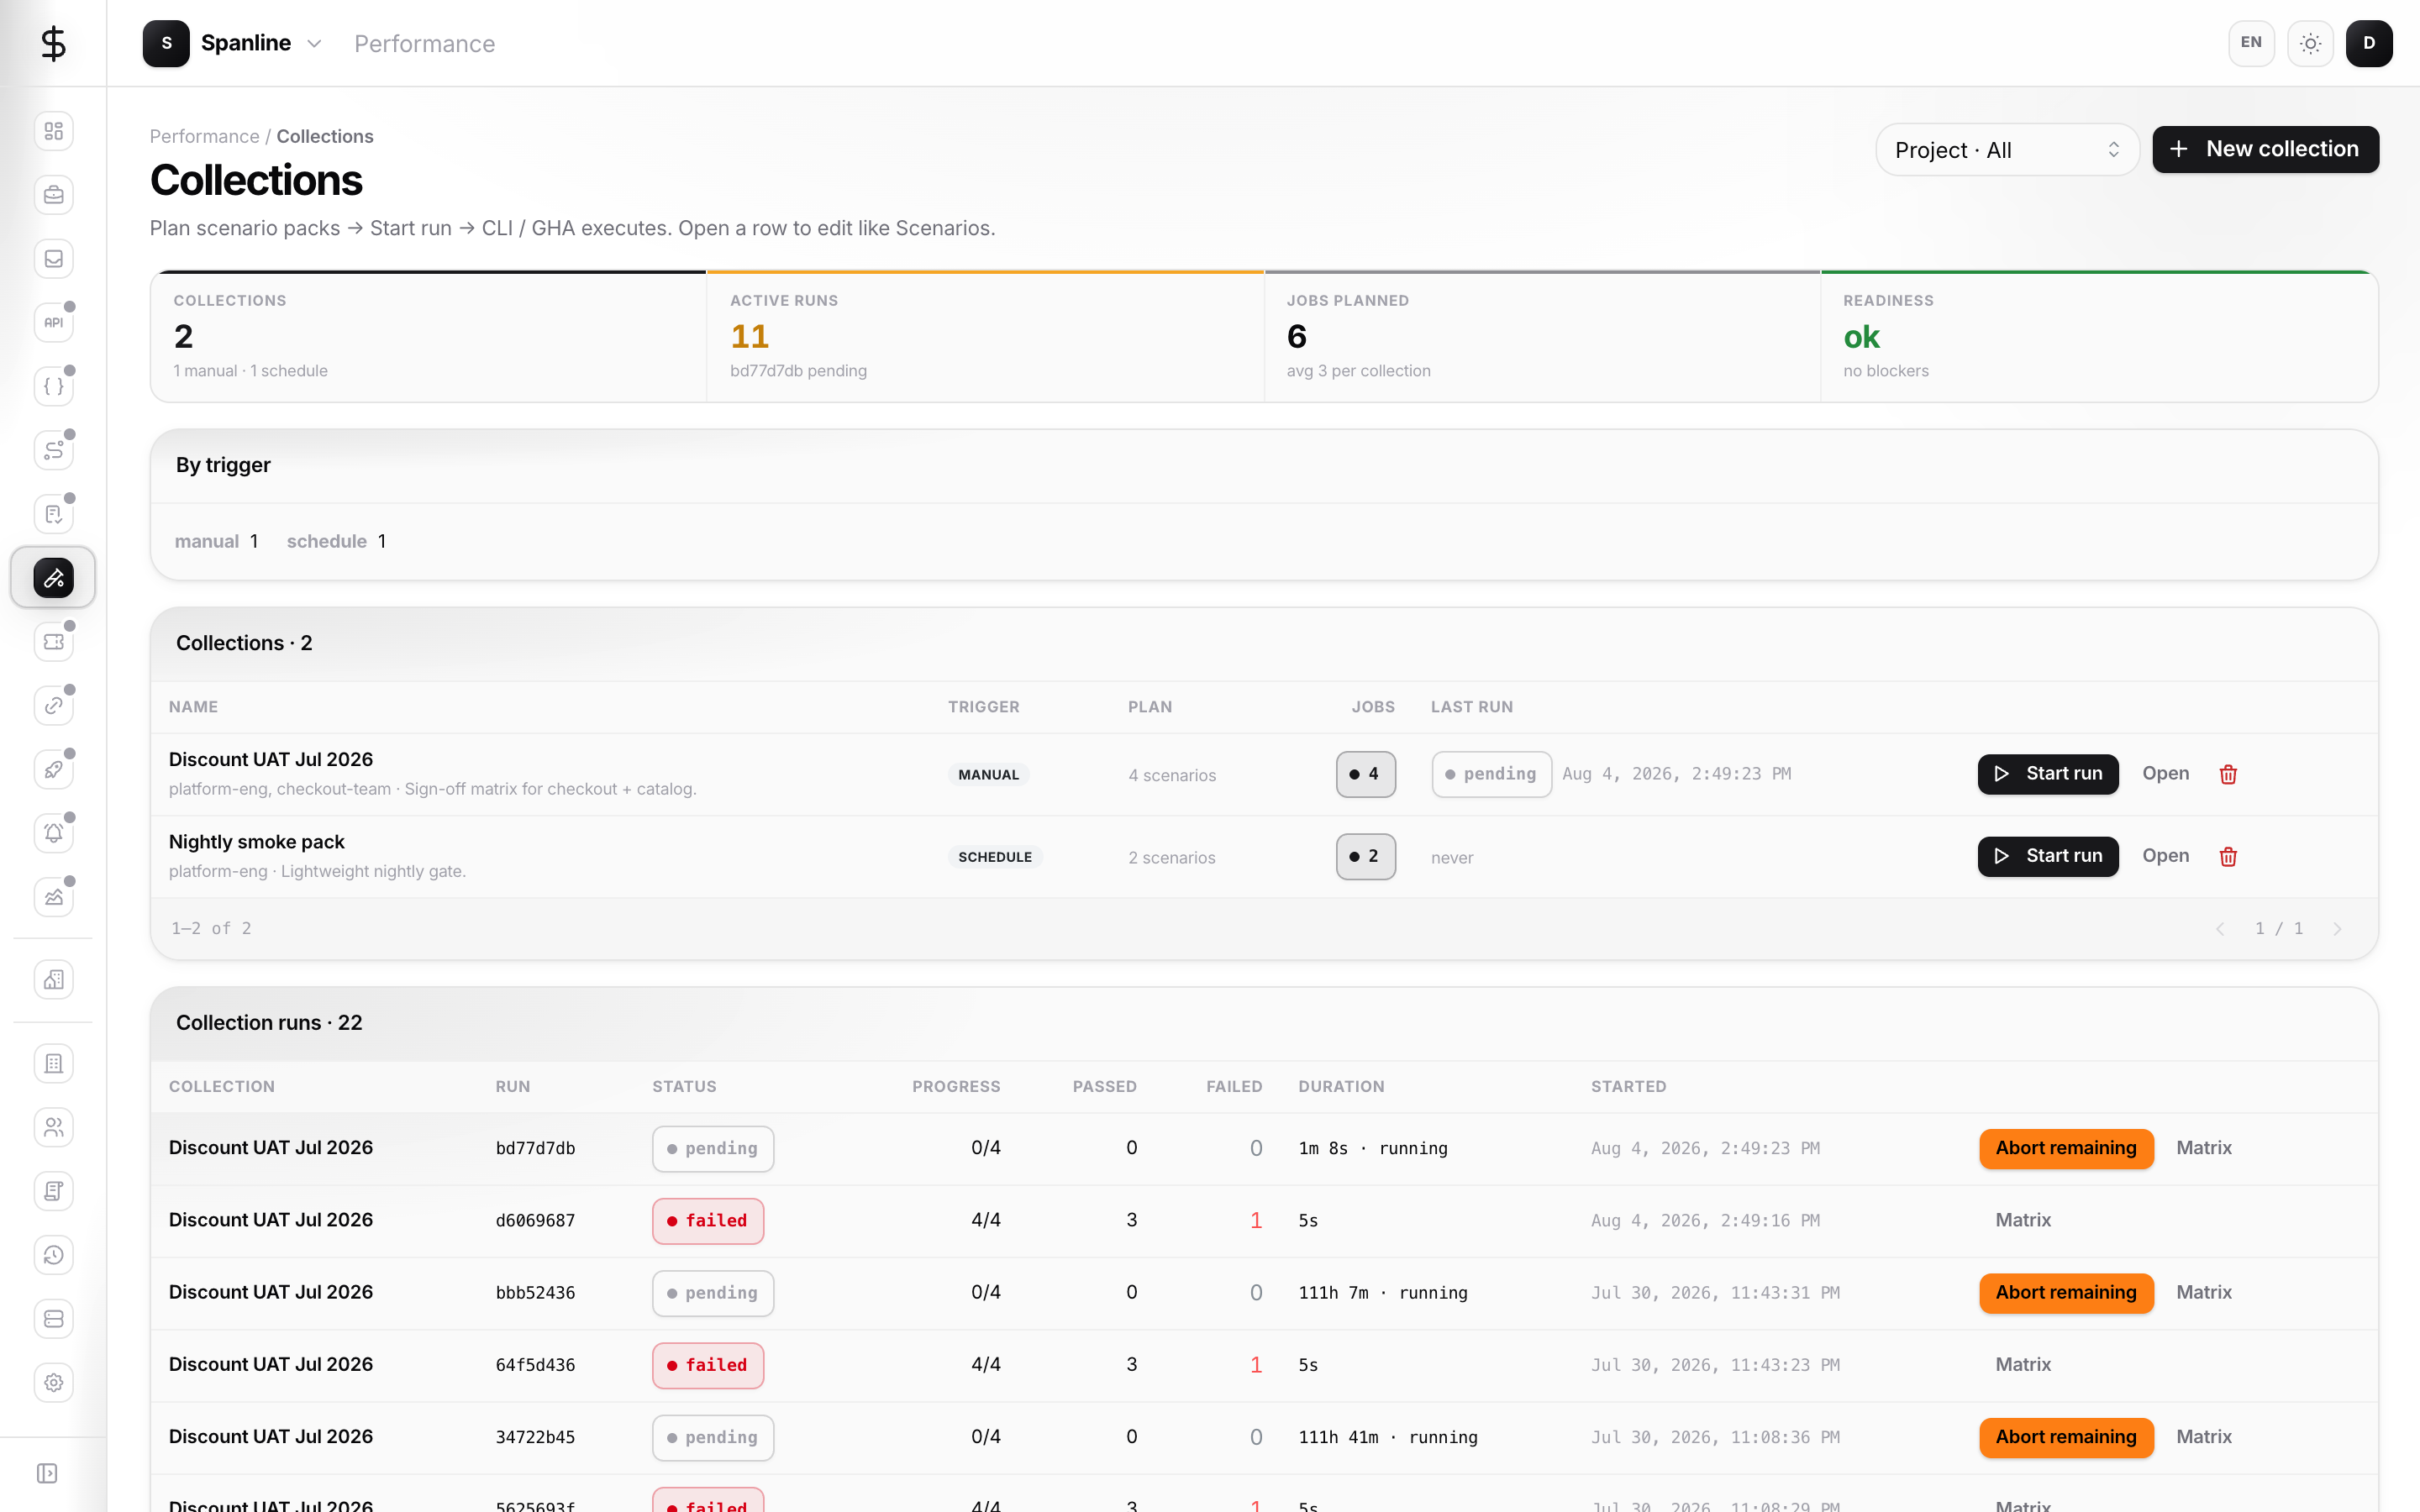
Collections are ordered scenario packs for a release-style gate.
- Open Performance → Collections and create a collection (or open a row to edit).
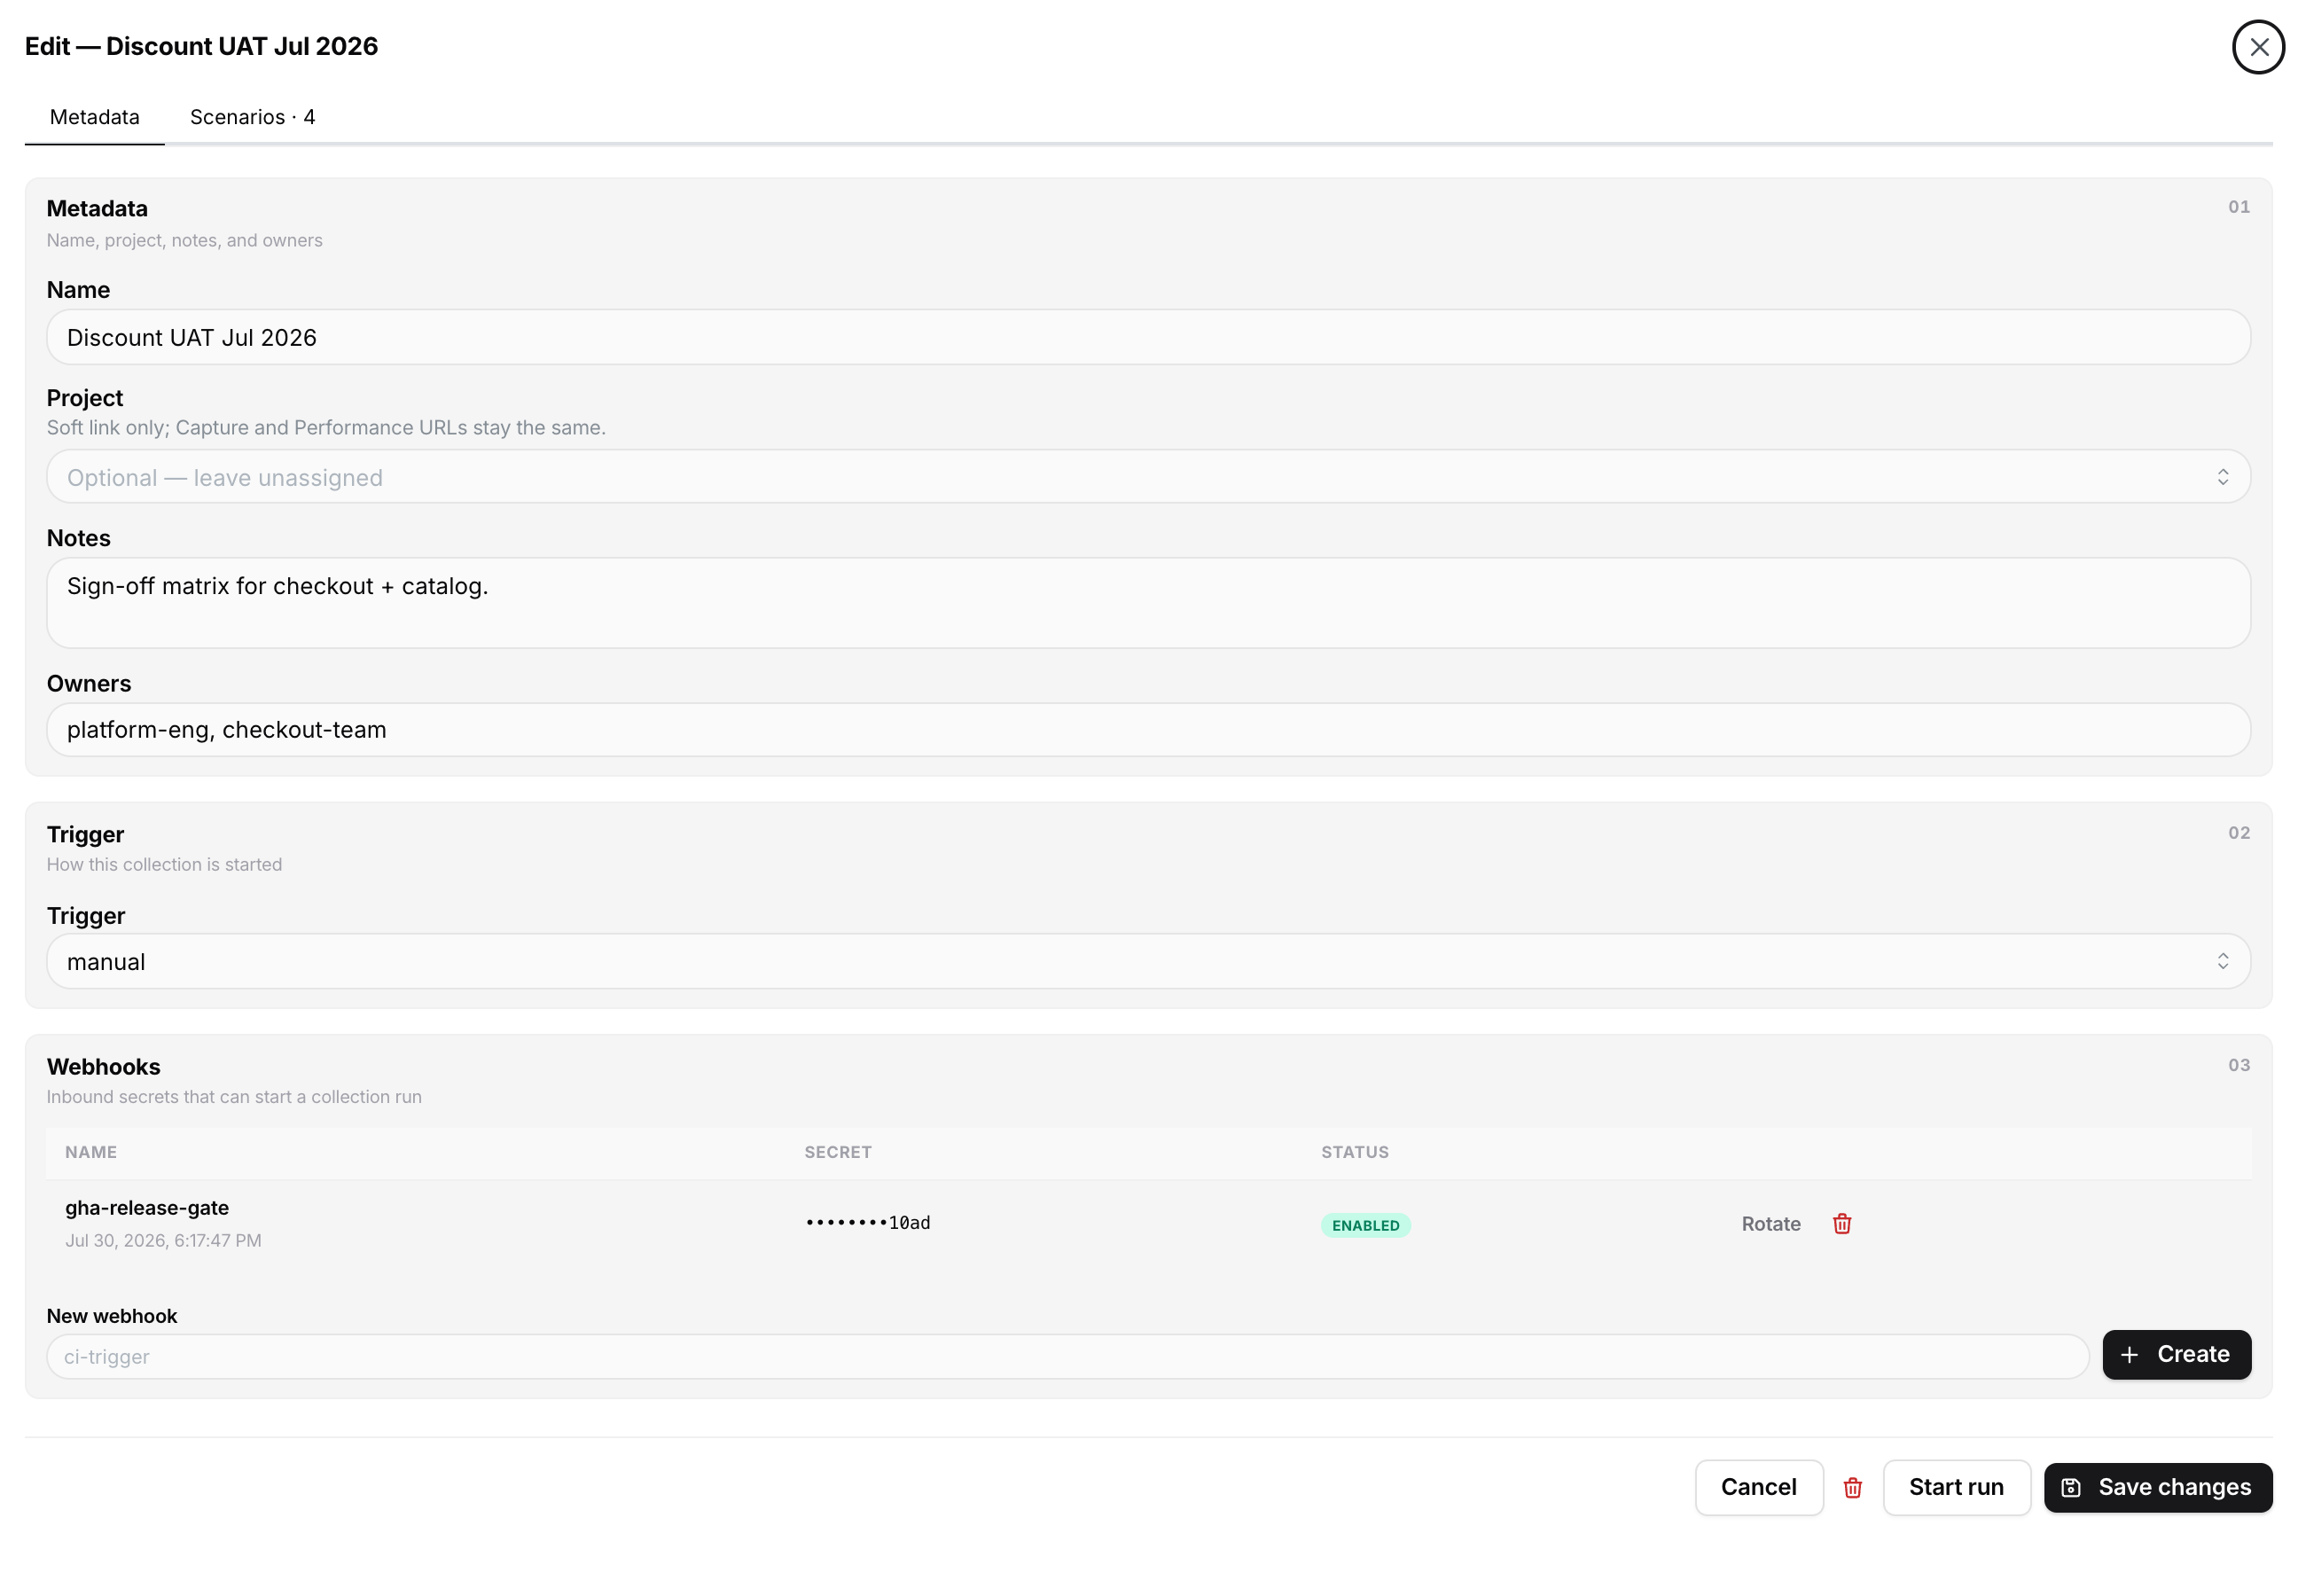
- In the editor, use Metadata (name, project, notes, owners, trigger) and Scenarios (ordered jobs).
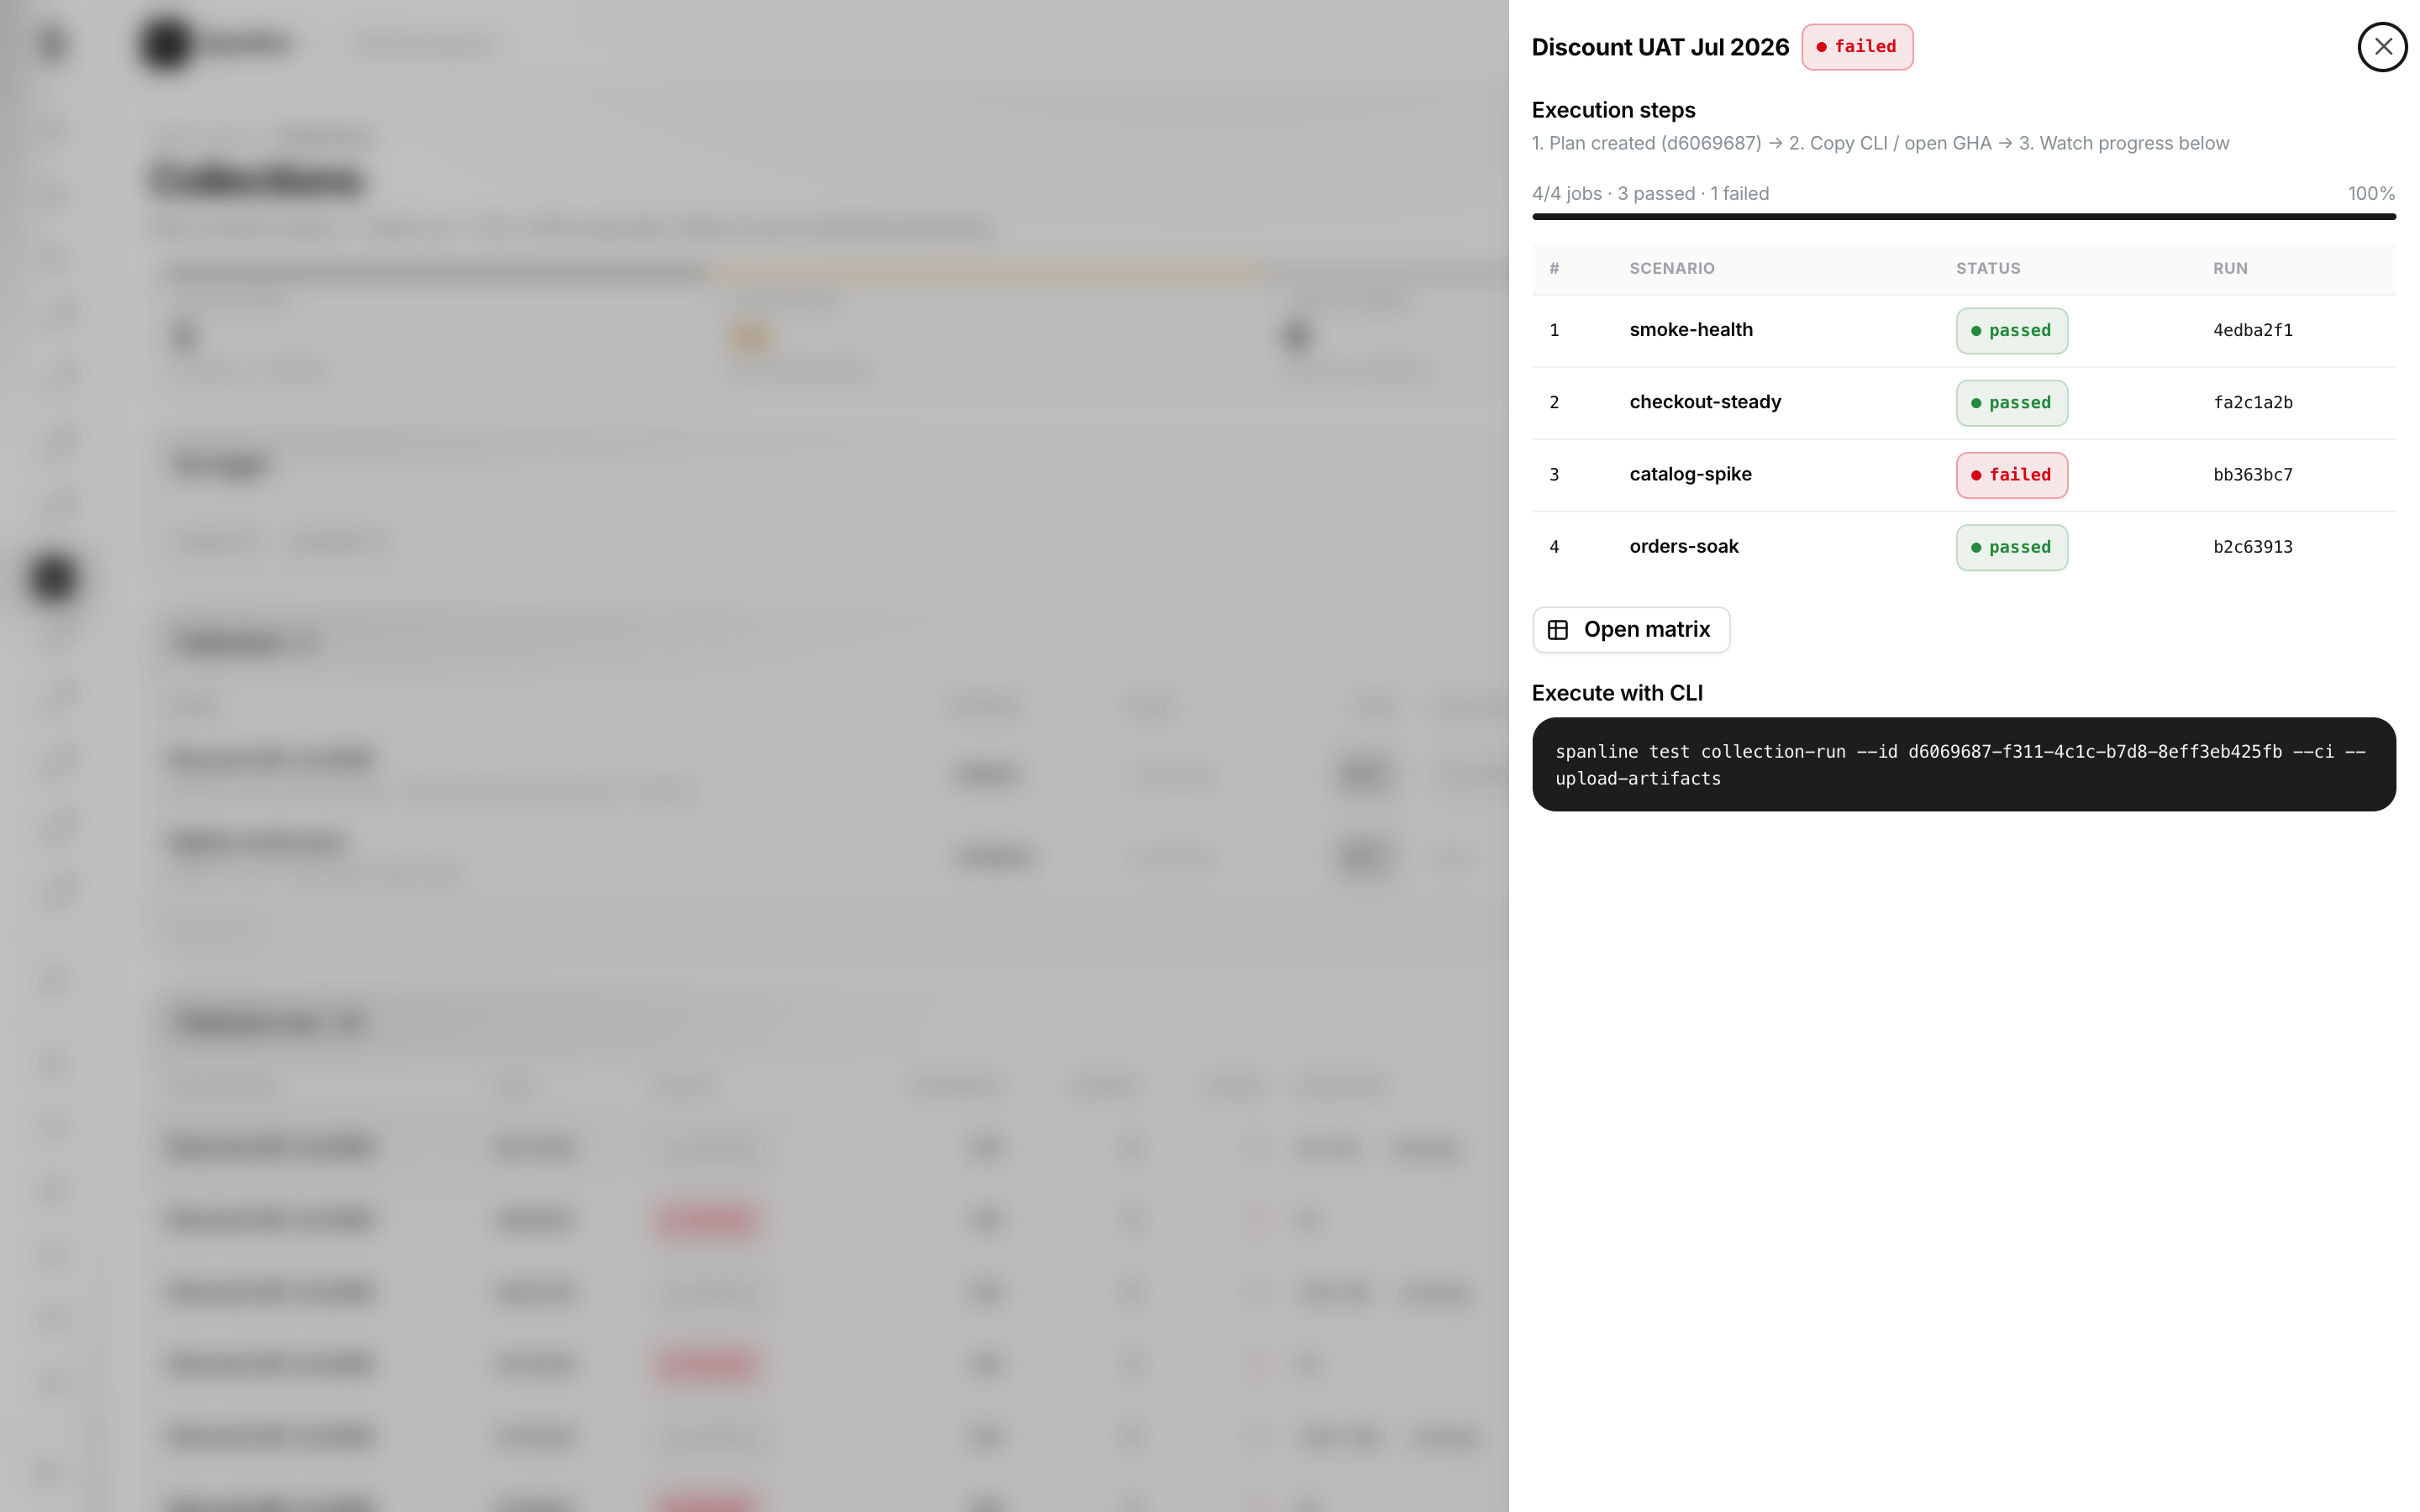
- Click Start run — that creates a pending collection-run plan and opens the execution drawer.
- Copy the collection-run id and execute with the CLI (
spanline test collection-run --id …) or your pipeline — see Run tests. - Watch job progress in the drawer. Use Abort remaining to stop unfinished jobs.
- When finished, open Performance → Matrix (or the drawer’s matrix link, optionally
?collectionRunId=) and use Export CSV.
Reminder: Matrix is tied to one collection run. Separate schedules → Reports → Collection window. Long-term drift → Trends.
Reports {#reports}
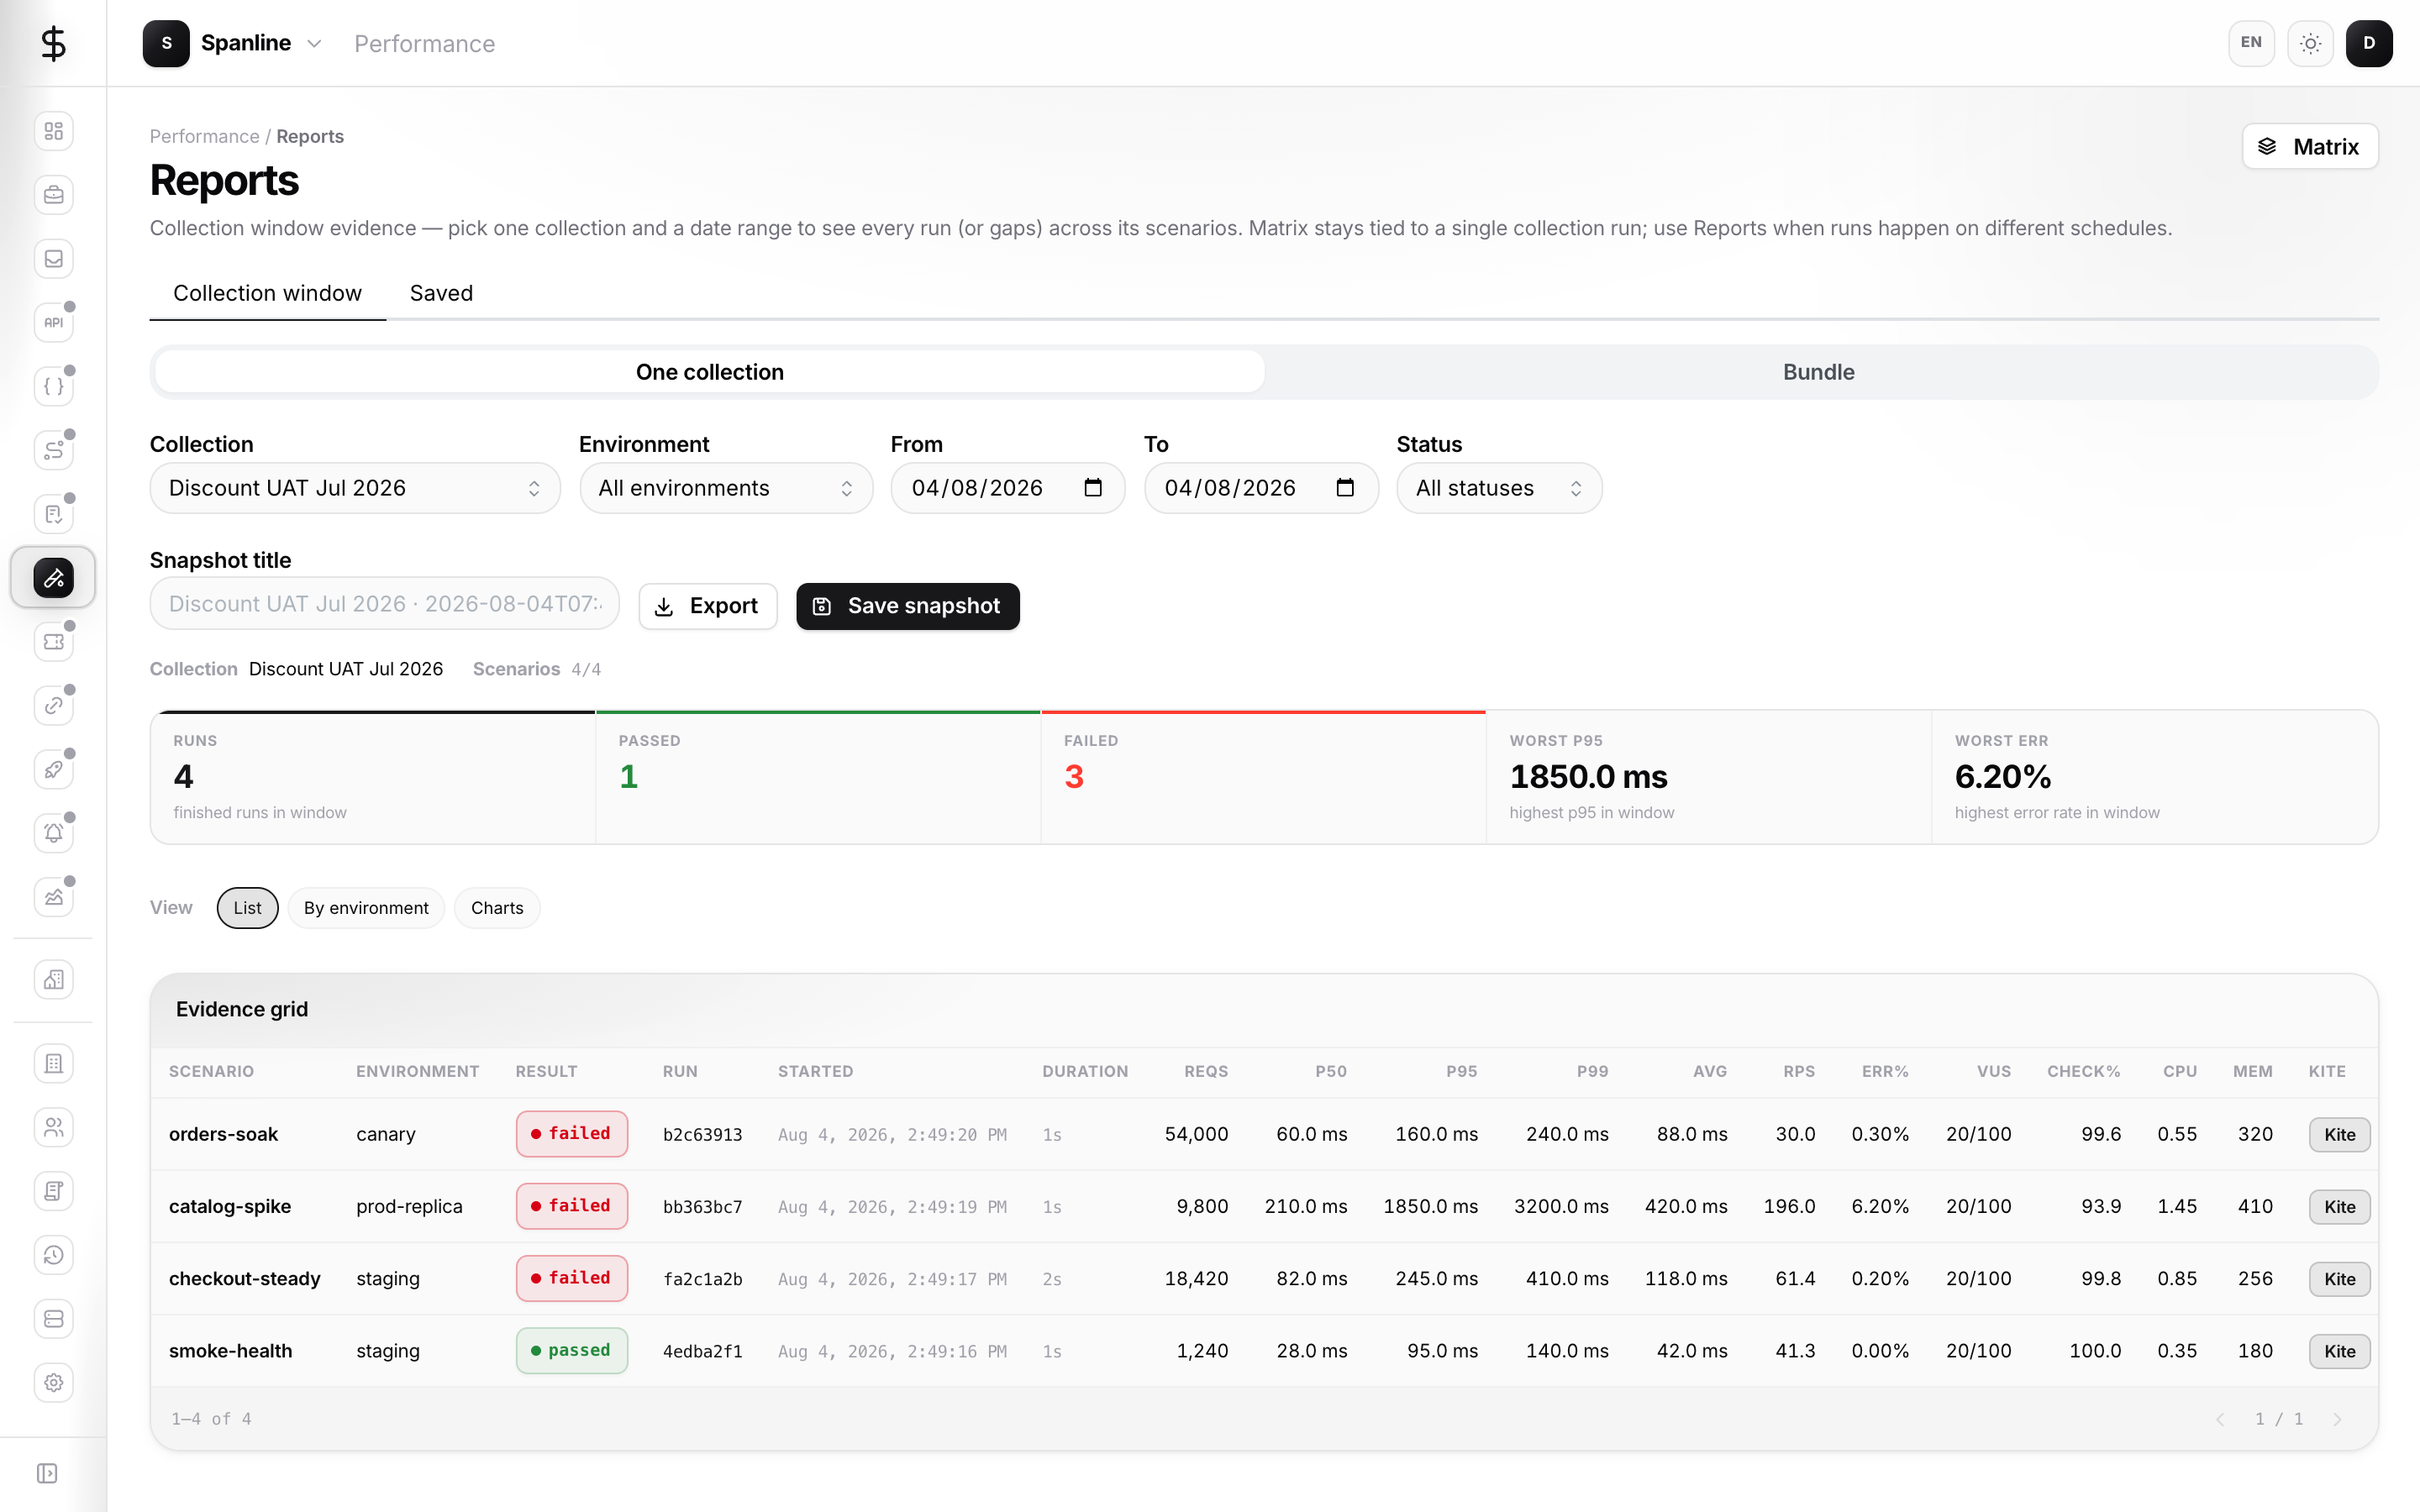
Use Performance → Reports for calendar-window evidence when Matrix’s single collection-run batch is not the right scope.
| Mode | When |
|---|---|
| One collection | One collection + From / To — gaps for missing scenarios |
| Bundle | Up to 20 collections (often via Project filter) — rollup KPI + accordion per collection |
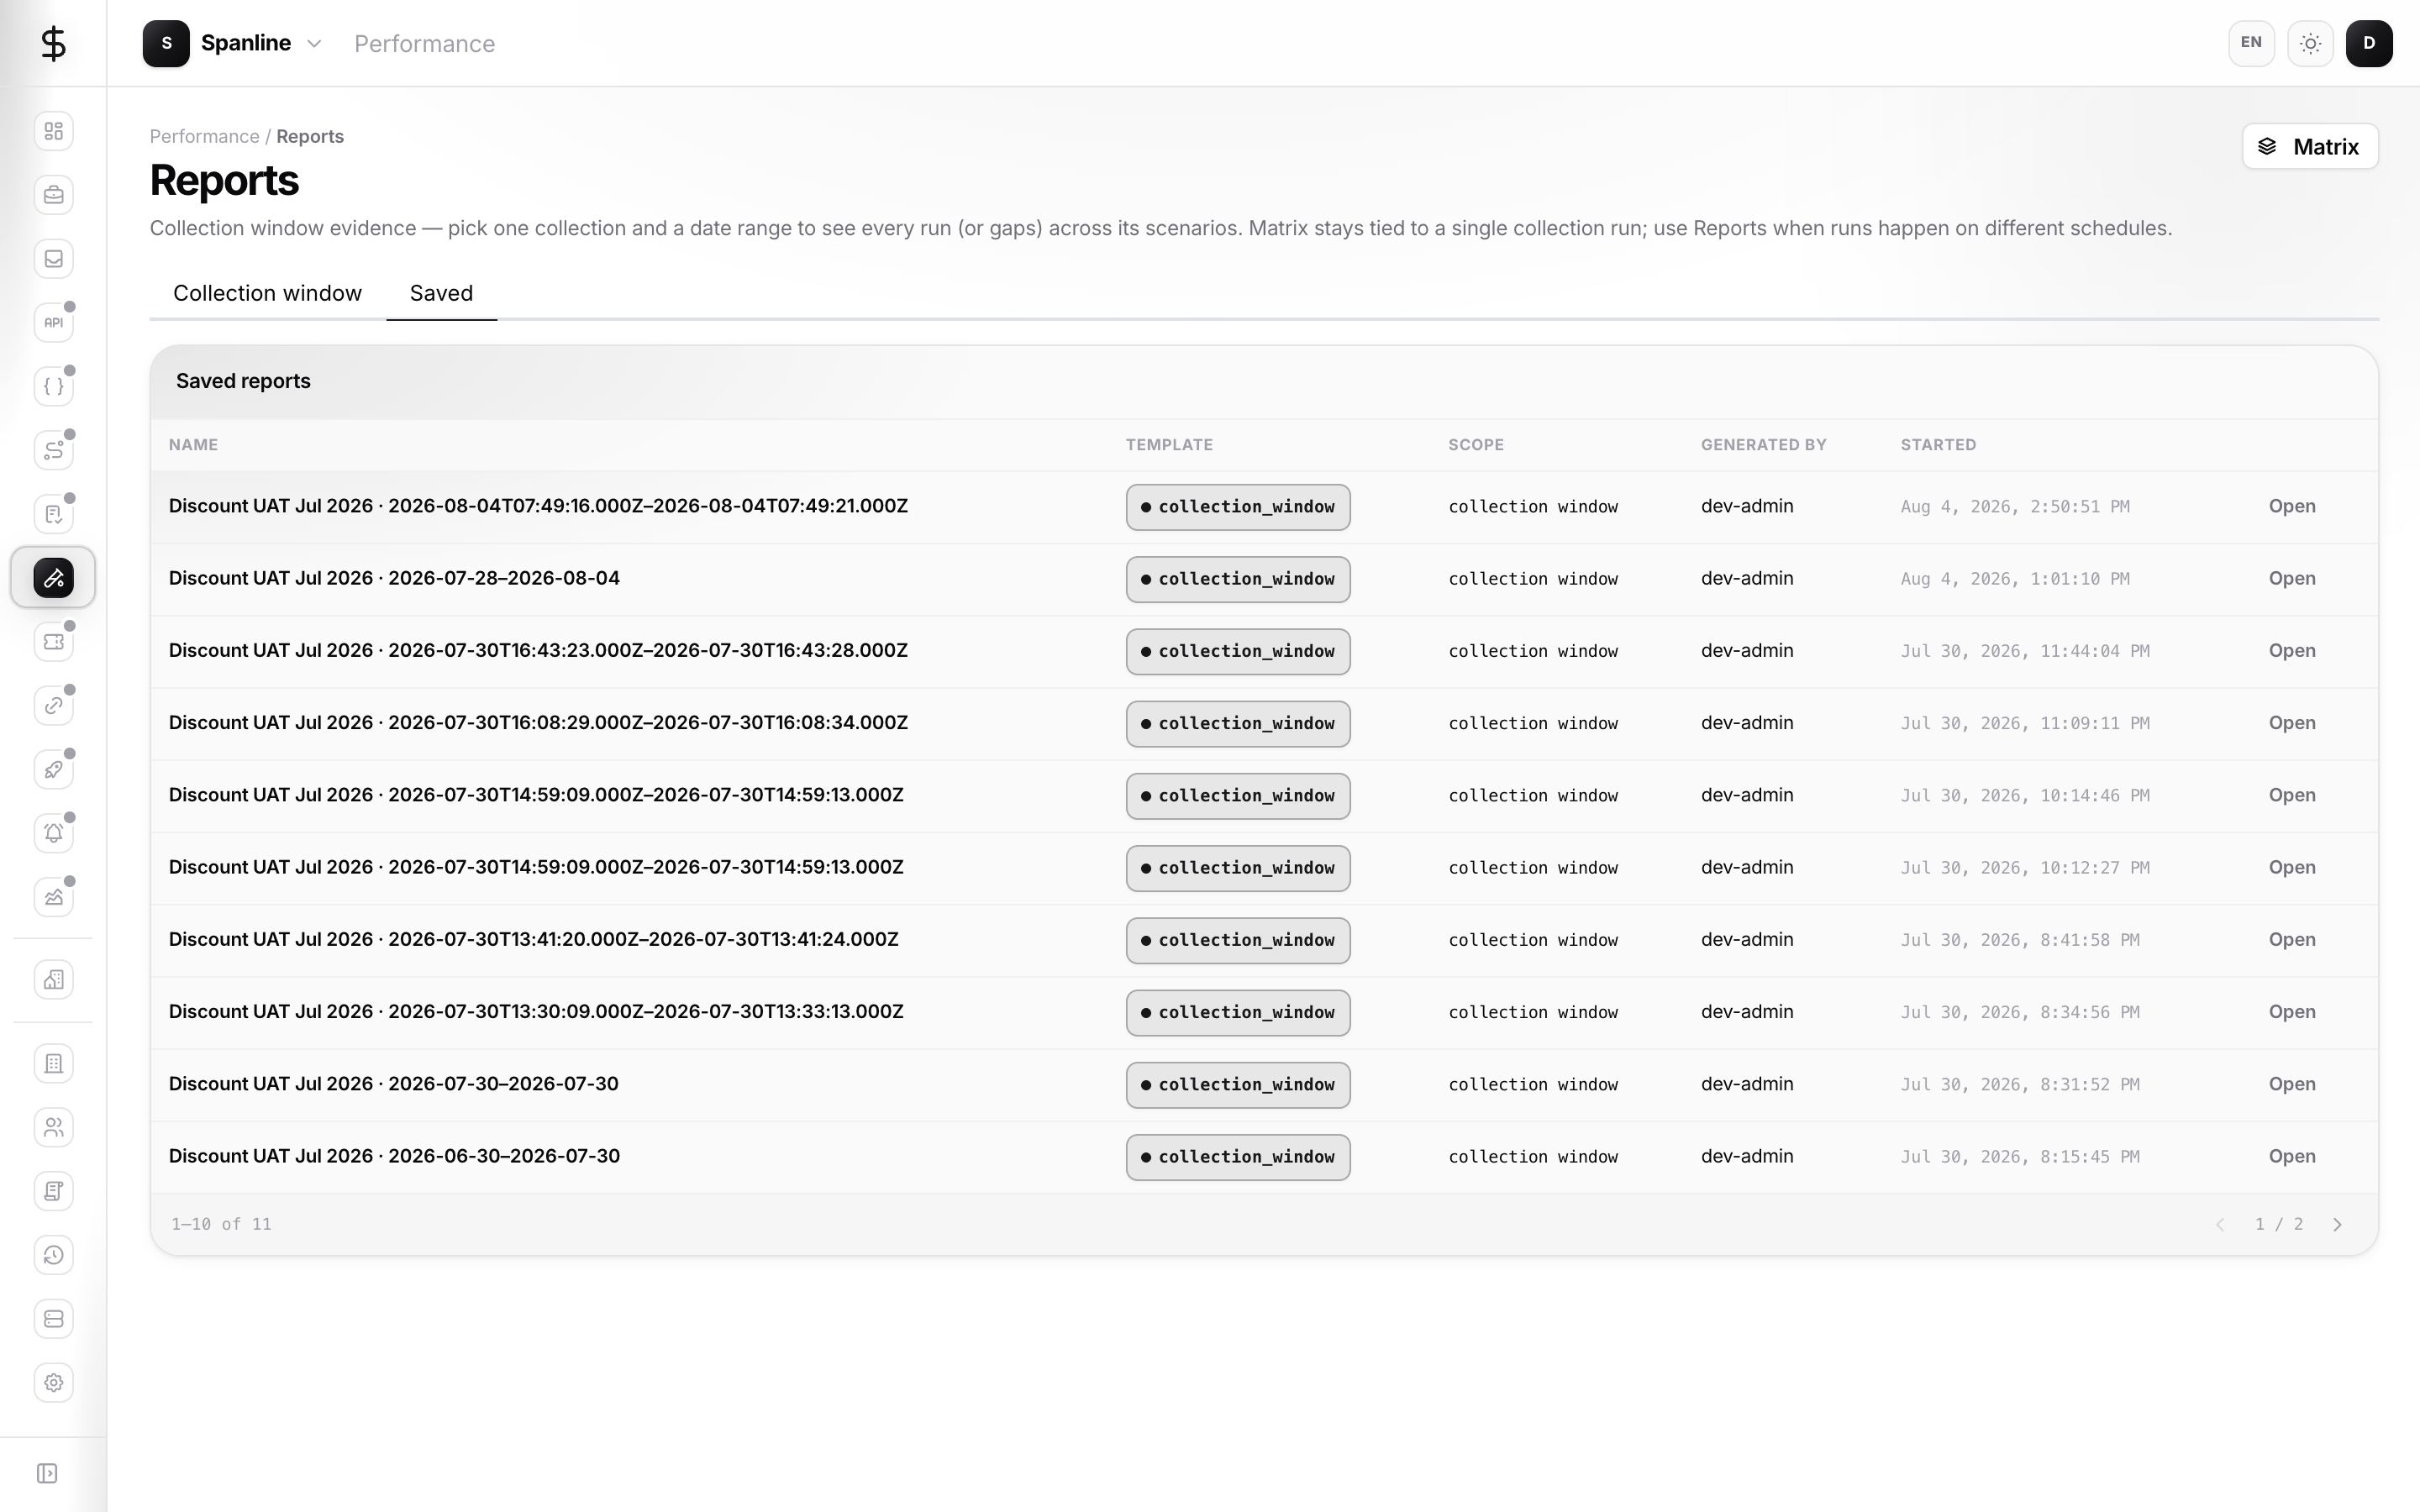
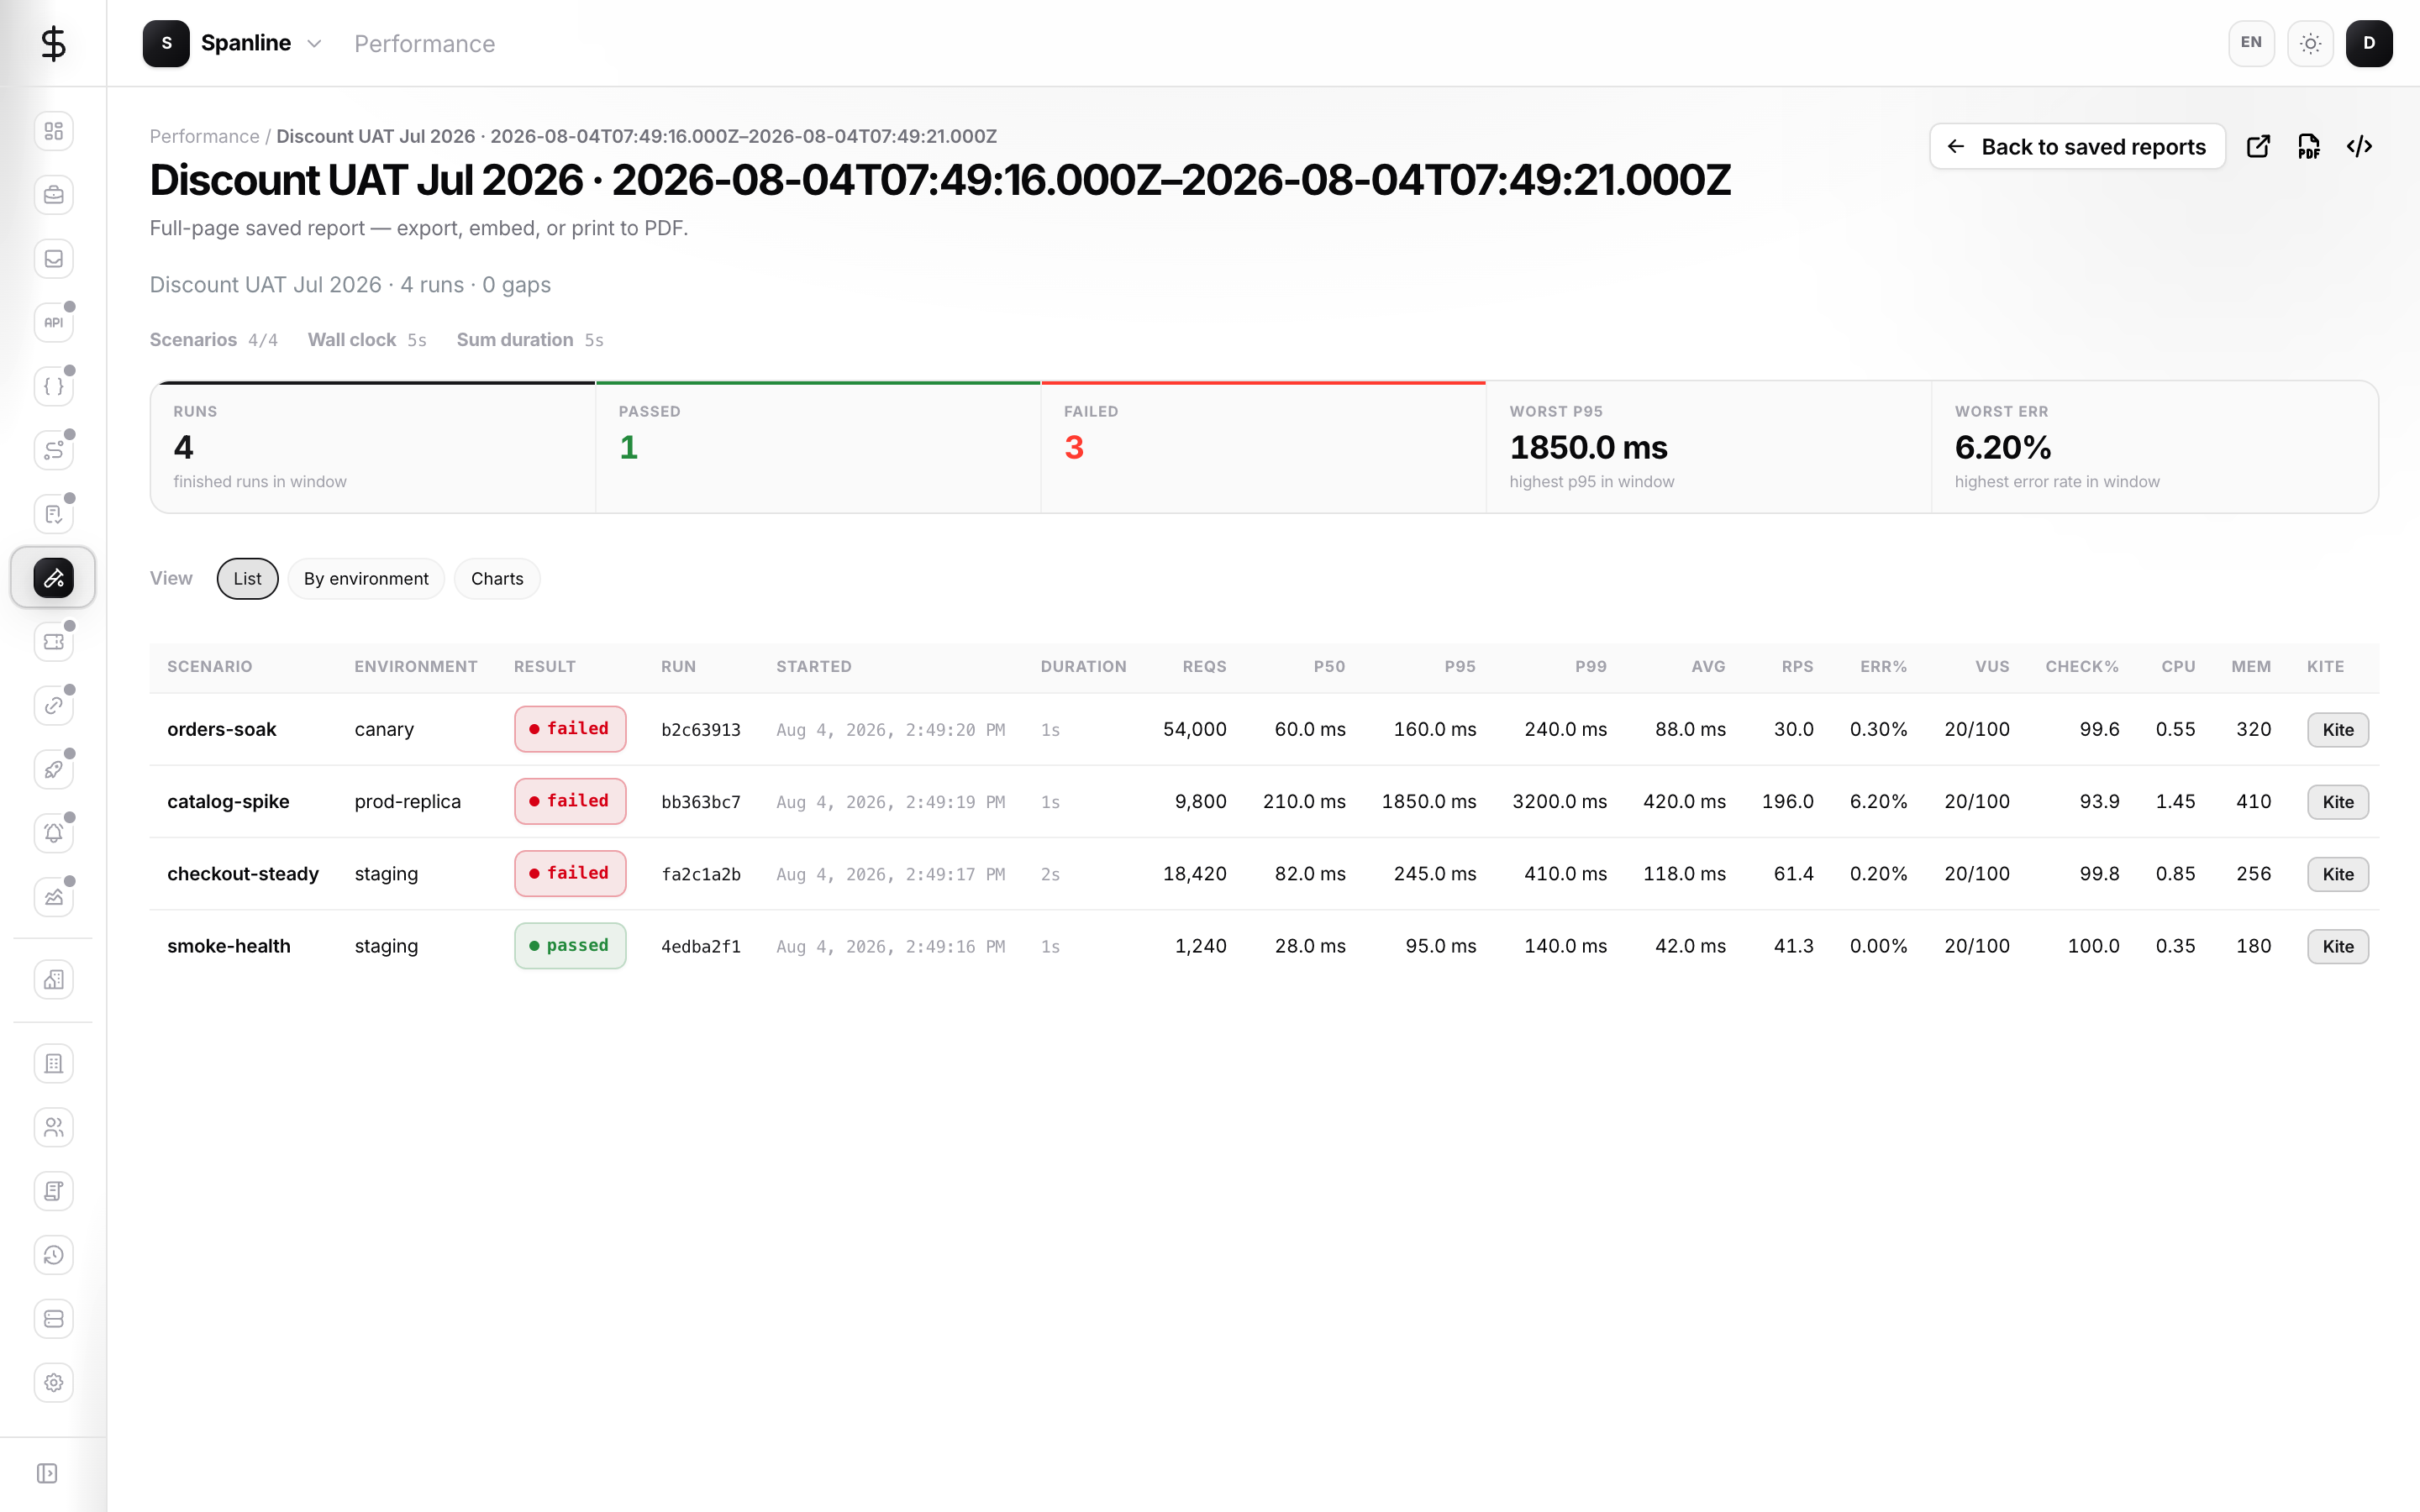
Quick steps: pick scope → collection(s) → dates → review KPIs and grid → Export CSV or Save snapshot → Saved tab → Open for the full-page viewer, PDF, workspace embed, or public unlock link.
Full detail (viewer page, Charts layout, 24h embed tokens, URL table, roles): Reports & sharing.
Trends
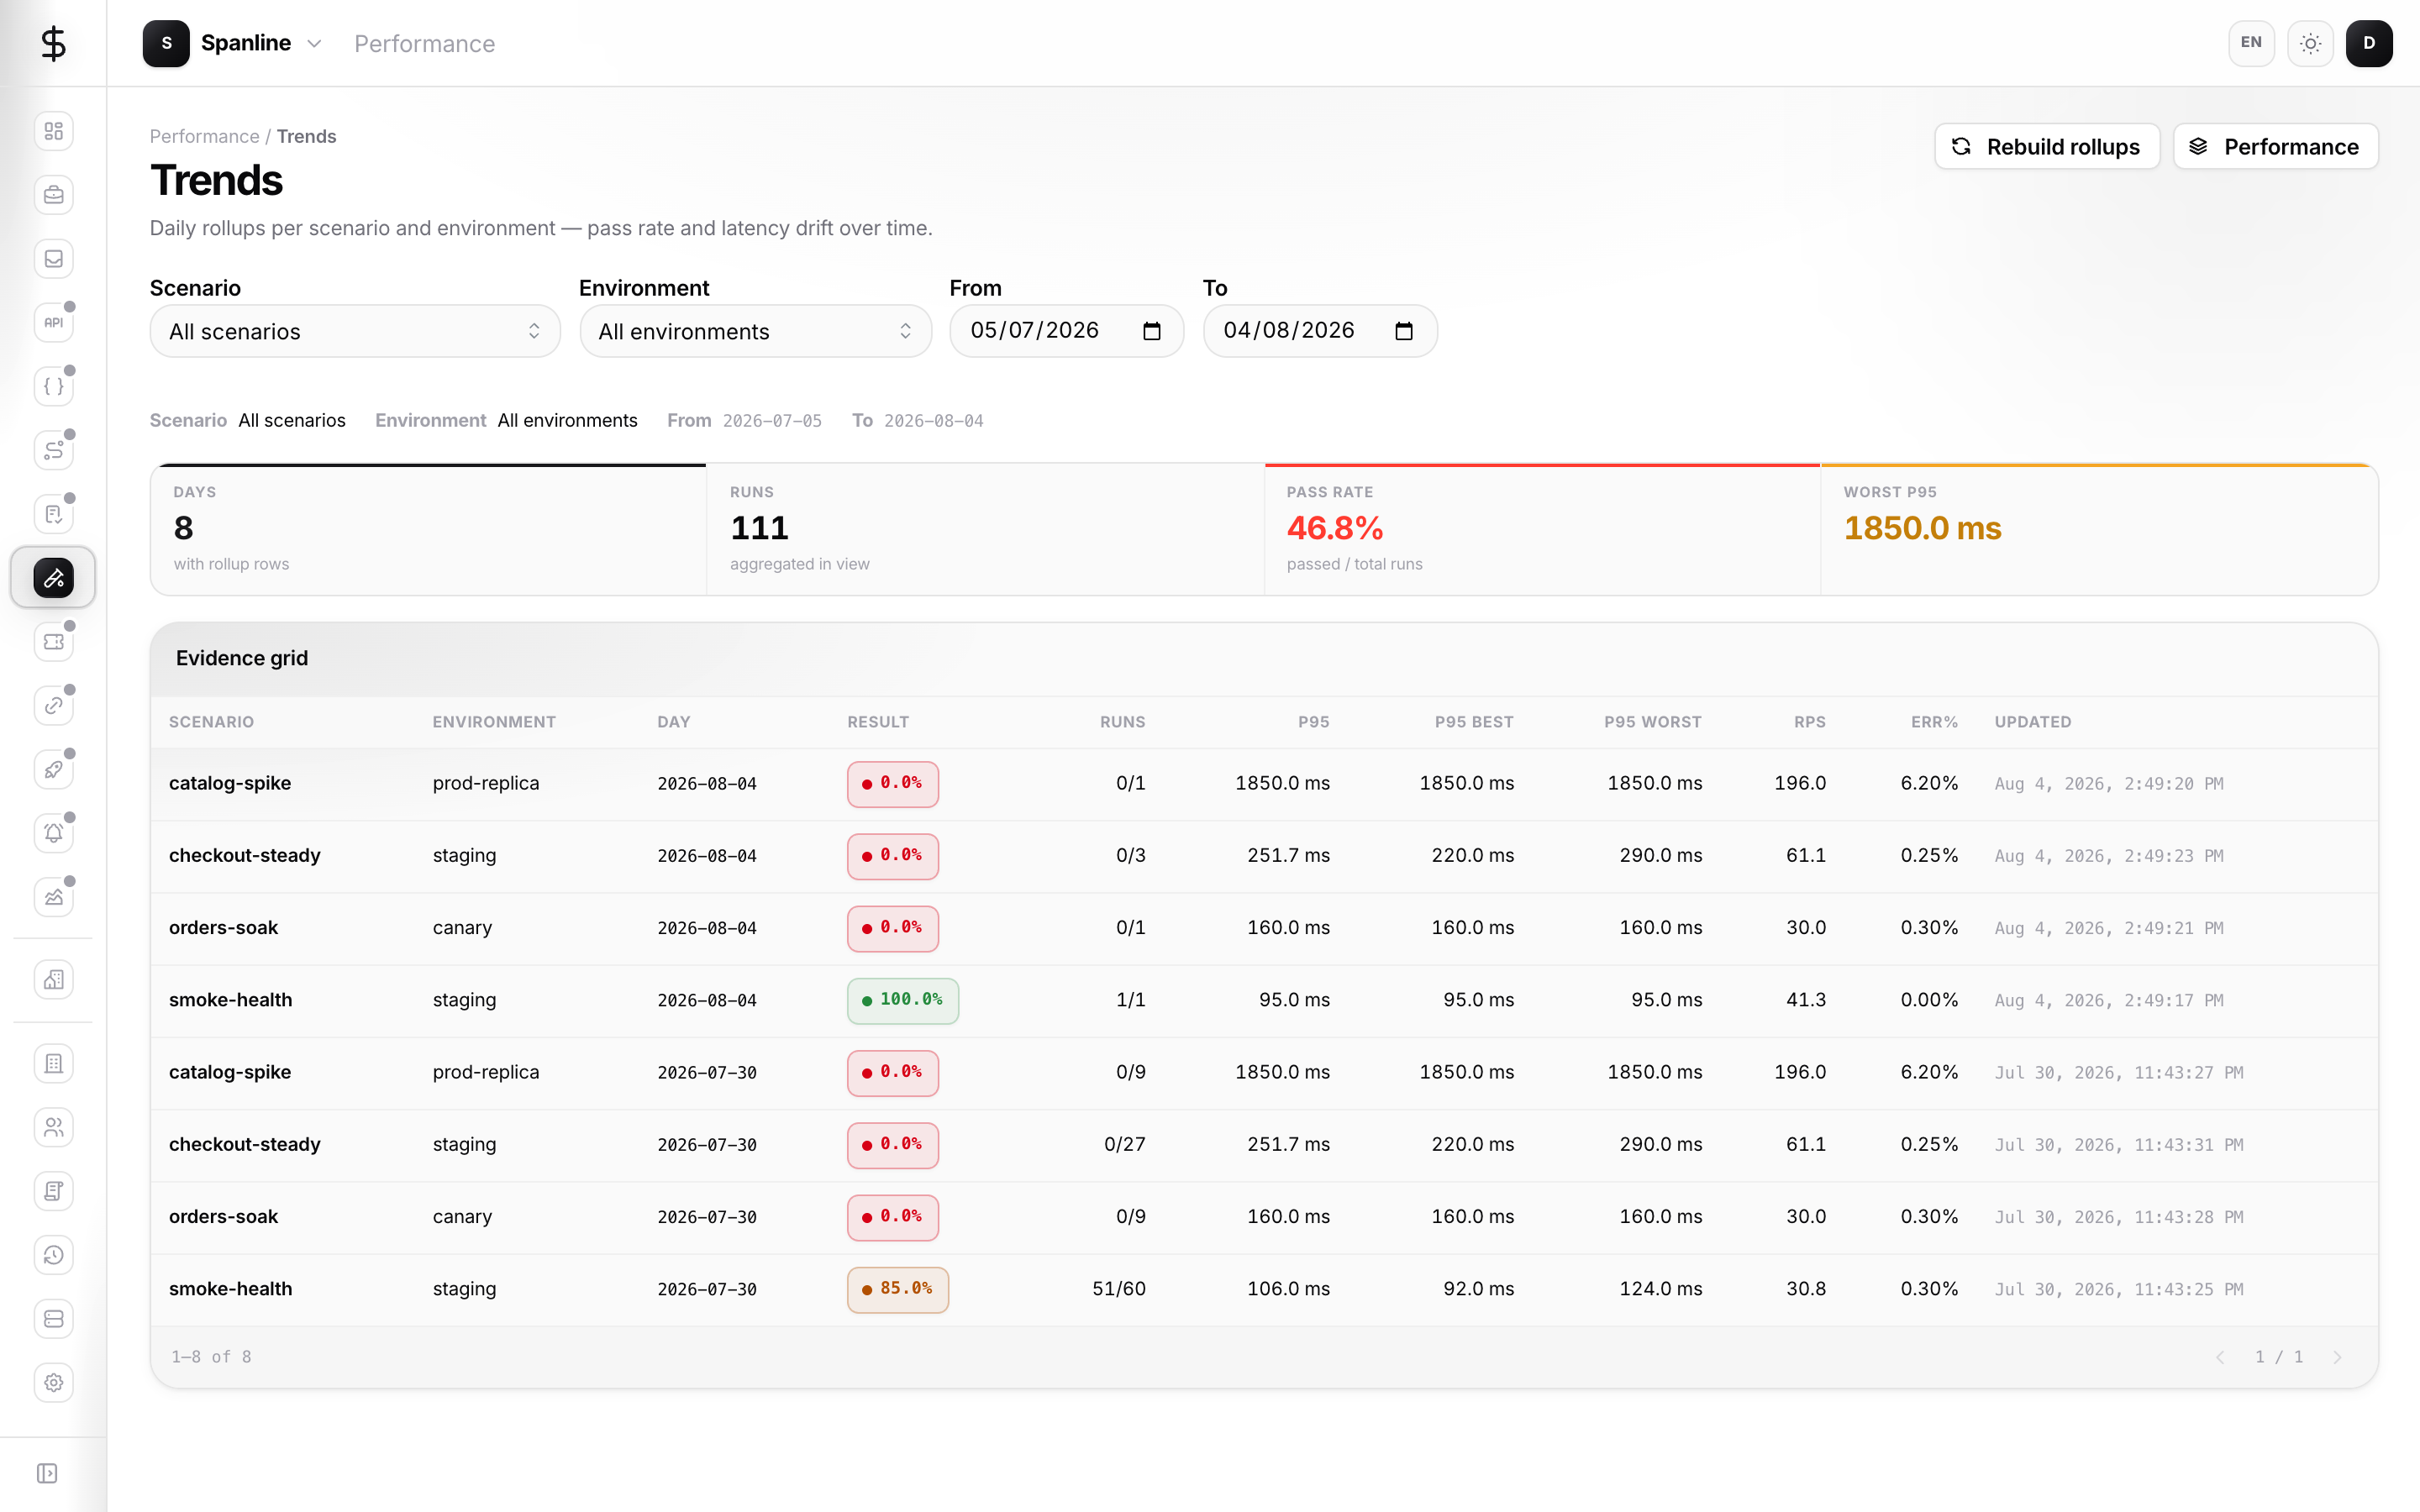
Performance → Trends is for monitoring, not gate evidence. It shows daily rollups per scenario and environment: pass rate, p95 (best/worst), RPS, and error rate — one row per day, not one row per run.
- Rollups update automatically when a run finishes (
passedorfailed). - Filter by scenario, environment, and from/to dates (URL params persist filters).
- Rows are aggregates — there are no per-run links. For run-level proof, use Matrix, Reports, or Runs.
- Workspace admins can Rebuild rollups to backfill from historical runs in a day range.
Collection webhooks
On the collection editor Metadata area, Webhooks lets an external system start a collection-run plan.
- Save the collection first (webhooks need an id).
- Create a webhook; copy the secret when it is shown (shown once).
- Use the inbound curl example from the UI (header includes the webhook secret).
- Have a runner pick up the plan with
spanline test watch --once(or your team’s equivalent). - Rotate or delete the webhook if the secret may have leaked.
Managing webhooks typically requires admin / owner. Keep secrets out of tickets and screenshots — see Access & secrets.
Triggers (what ships today)
| Trigger | Meaning |
|---|---|
| manual | You click Start run in the app |
| webhook | Inbound secret creates a plan; a runner executes it |
| cron | Schedule fields are metadata only — Spanline does not fire the cron yet. Use external CI or test watch until registered runners ship |
Connections
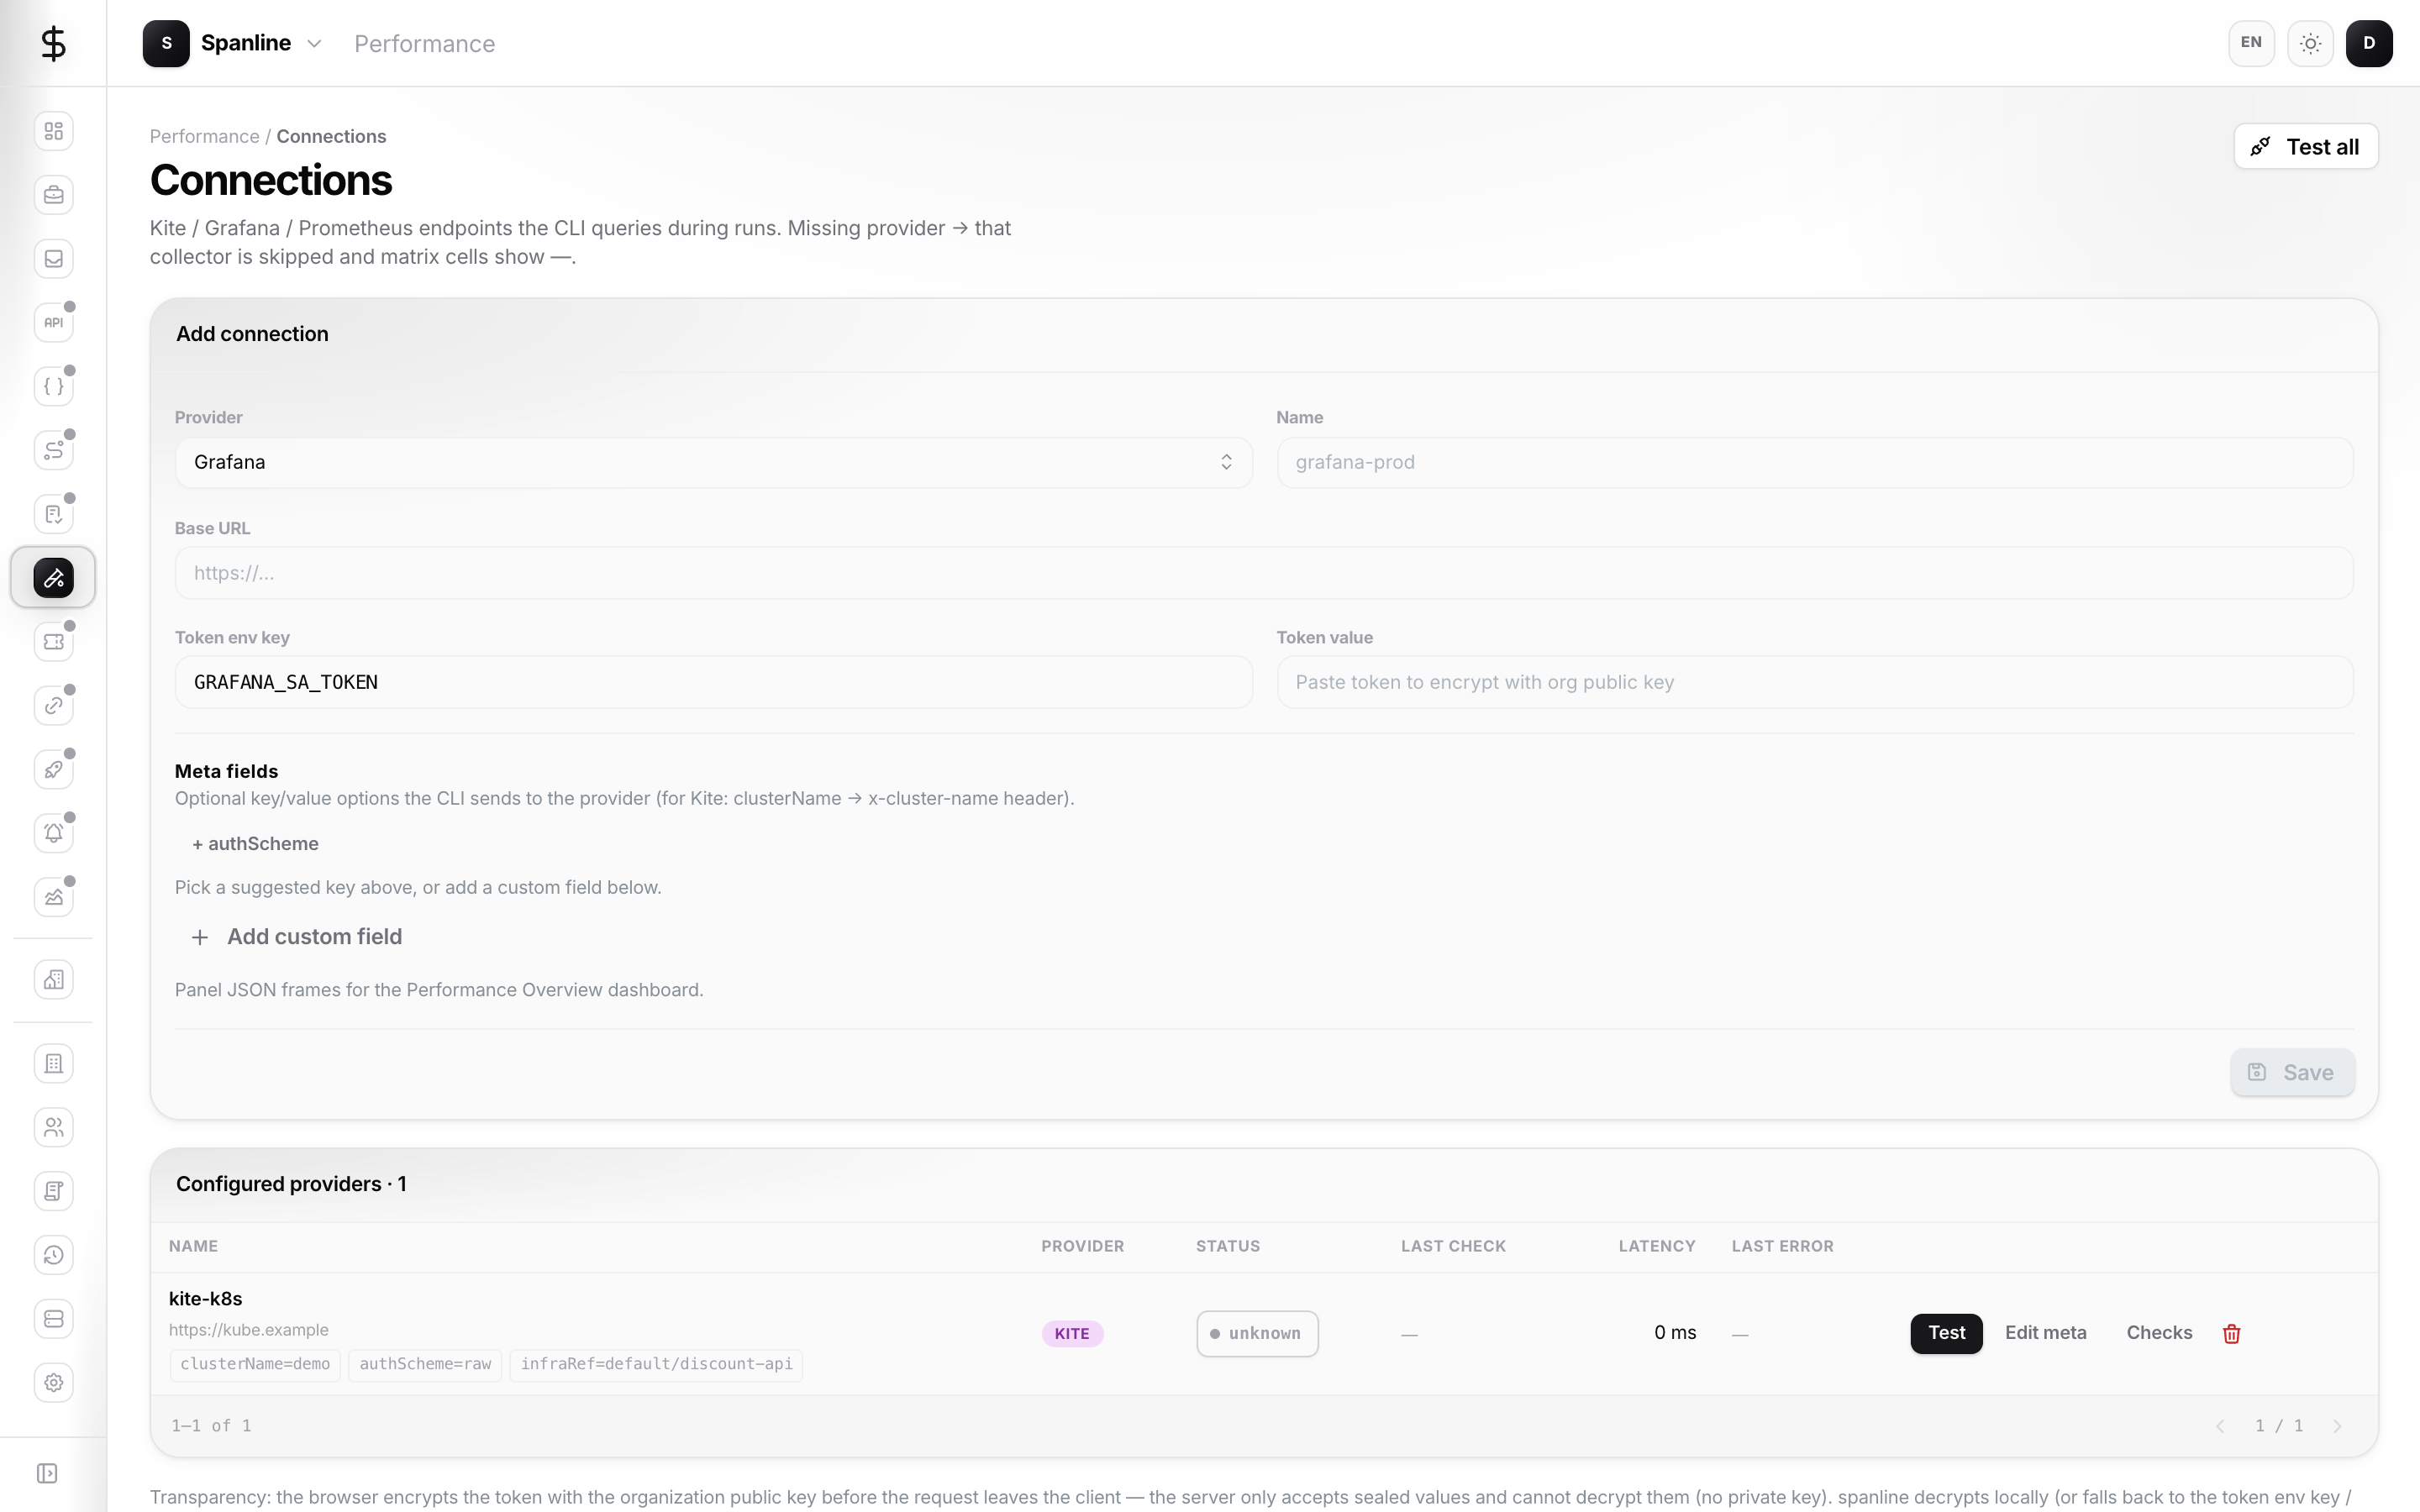
Add a Connection when you want Spanline to know about an external Grafana, Prometheus-style, or related endpoint.
- Open Performance → Connections.
- Create a connection and fill endpoint details.
- Test the connection from the app (Test all when you have several).
- Keep tokens in sealed secret fields when available.
Project filter
On Scenarios and Collections, the toolbar control labeled Project · All filters lists for your browser session. Link a project when you create or edit a scenario/collection so rows participate in that filter.
Overview KPIs (quick read)
| KPI | Meaning |
|---|---|
| Total runs | Runs recorded in this workspace |
| Pass rate | Share of finished runs that passed |
| Inventory | Counts of envs / scenarios / collections (and “ready for gate”) |
| Running now | Live runs currently streaming |
Empty states (No runs yet, No collection runs yet) mean no runner has uploaded yet — not that the product is broken. Chain reminder on the hub: Scenarios → Collections (plan) → CLI collection-run → Matrix / Compare, or ad-hoc runs → Reports (collection window) / Trends.
Coming later (not documented as available)
Product rail Soon tabs — Scripts, Thresholds — are placeholders. Named saved comparison links and in-app Matrix JSON export are not available yet (use CLI test matrix --format json for JSON).
Related
- Getting started — first smoke test
- Concepts — glossary and roles
- Run tests — CLI and CI
- FAQ — common failures
- Reports & sharing — snapshots, bundle, public unlock